OPEN-SOURCE SCRIPT
Aggiornato Moving Average Gap Analyzer
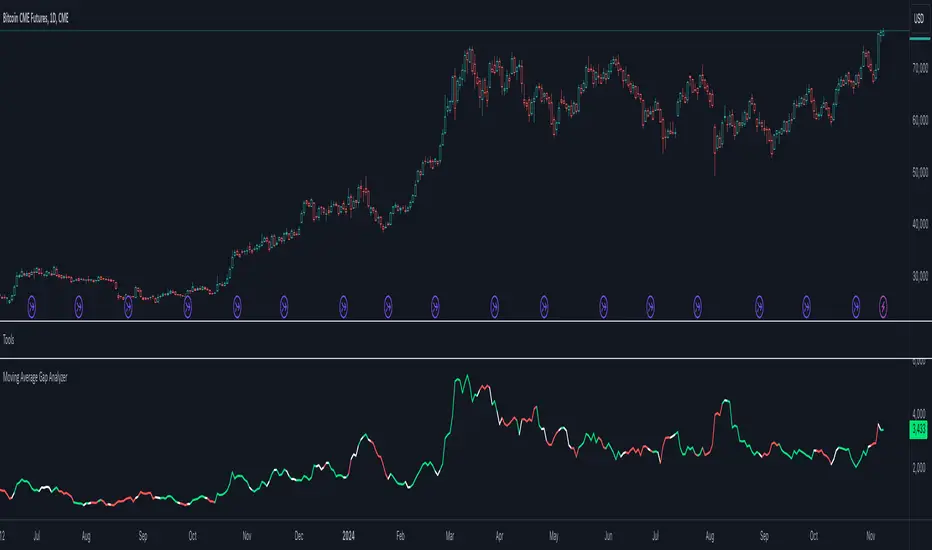
Extremely simple algorithm in order to calculate the gap between 2 simple moving averages. Analyzing perspective defines the line of color as white, green or red. This is done by checking sources of both moving averages and evaluate their past values with the mutual length respectively. Analysis is done by scoring the movements of sources.
What to expect?
- Higher the gap, higher the volatility.
- If the analysis line is green sources have been raising (most likely bull market), if the analysis line is white the market is mostly likely close to horizontal, if the analysis line is red, sources have been decreasing gradually (most likely bear market).
ps. Genuine indicator idea of me. This indicator is not a product or an idea of any group I work with. Completely clear of all types of IP.
Note di rilascio
- Option for selecting MA type added.Note di rilascio
- Script updated from Pine Script v4 to Pine Script v5
- Dynamic moving average function moved to a library (Tools)
- Strict variable types implemented & applied
Script open-source
Nello spirito di TradingView, l'autore di questo script lo ha reso open source, in modo che i trader possano esaminarne e verificarne la funzionalità. Complimenti all'autore! Sebbene sia possibile utilizzarlo gratuitamente, ricordiamo che la ripubblicazione del codice è soggetta al nostro Regolamento.
Declinazione di responsabilità
Le informazioni e le pubblicazioni non sono intese come, e non costituiscono, consulenza o raccomandazioni finanziarie, di investimento, di trading o di altro tipo fornite o approvate da TradingView. Per ulteriori informazioni, consultare i Termini di utilizzo.