OPEN-SOURCE SCRIPT
Aggiornato Dynamic Intraday HLC levels [Sudeb]

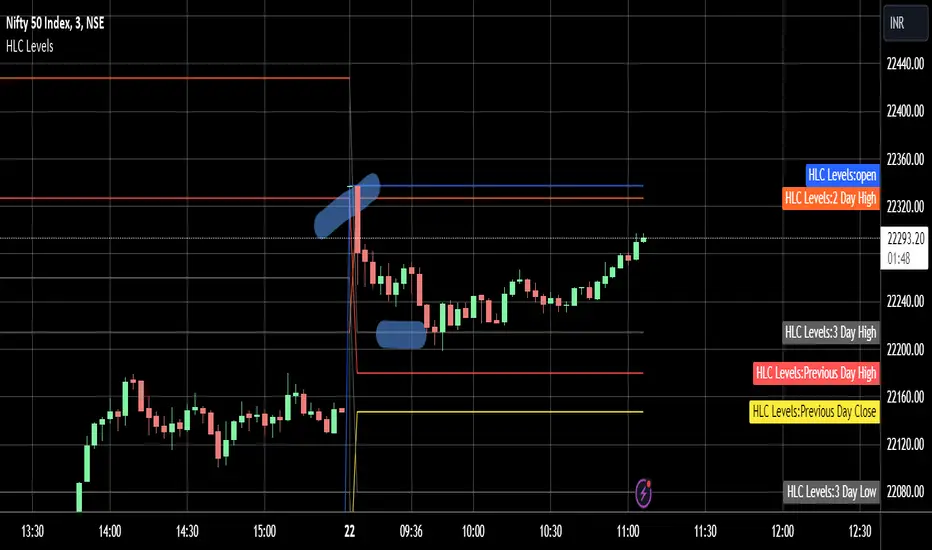
This is a simple indicator which will mark High & Low of last three days.
Close of Previous Day
The High lines will show in RED color, Low lines in green & close lines in Yellow.
The advantage of using this indicator is - It will greyed out or fade the color of any previous day level if the price is breached of that level.
For example if 2 day's ago High price is breached by 1 day's ago High, then the 2 Day's ago High level color will greyed out in current day chart. Thus giving you a confirmation whether it's a fresh or already tested levels.
Note di rilascio
Few code modifications have been made. Note di rilascio
Few code updates have been made. Script open-source
Nello spirito di TradingView, l'autore di questo script lo ha reso open source, in modo che i trader possano esaminarne e verificarne la funzionalità. Complimenti all'autore! Sebbene sia possibile utilizzarlo gratuitamente, ricordiamo che la ripubblicazione del codice è soggetta al nostro Regolamento.
Declinazione di responsabilità
Le informazioni e le pubblicazioni non sono intese come, e non costituiscono, consulenza o raccomandazioni finanziarie, di investimento, di trading o di altro tipo fornite o approvate da TradingView. Per ulteriori informazioni, consultare i Termini di utilizzo.
Script open-source
Nello spirito di TradingView, l'autore di questo script lo ha reso open source, in modo che i trader possano esaminarne e verificarne la funzionalità. Complimenti all'autore! Sebbene sia possibile utilizzarlo gratuitamente, ricordiamo che la ripubblicazione del codice è soggetta al nostro Regolamento.
Declinazione di responsabilità
Le informazioni e le pubblicazioni non sono intese come, e non costituiscono, consulenza o raccomandazioni finanziarie, di investimento, di trading o di altro tipo fornite o approvate da TradingView. Per ulteriori informazioni, consultare i Termini di utilizzo.