OPEN-SOURCE SCRIPT
Aggiornato Big 7 NASDAQ
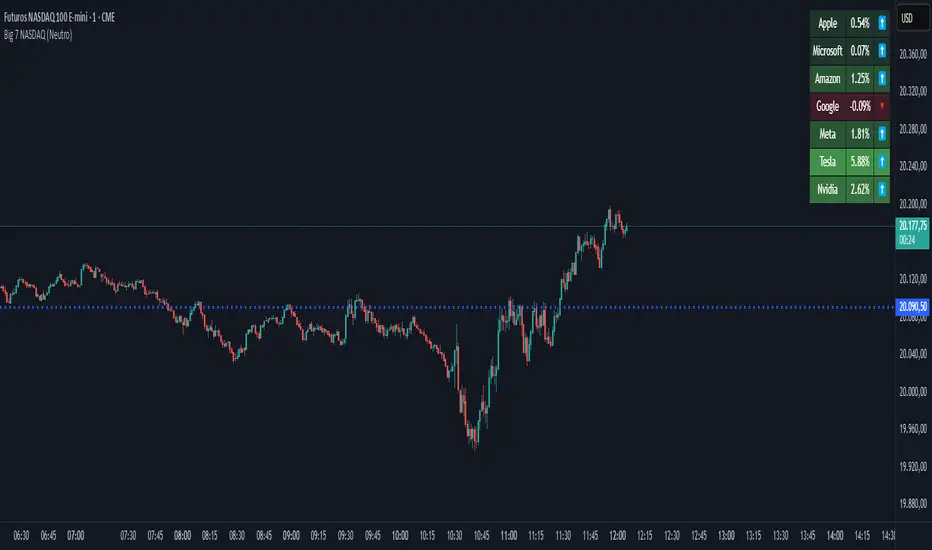
📊 Big 7 NASDAQ % Change Heatmap with Trend Arrows
This indicator displays a real-time performance table for the "Big 7" NASDAQ stocks:
Apple (AAPL), Microsoft (MSFT), Amazon (AMZN), Google (GOOGL), Meta (META), Tesla (TSLA), and Nvidia (NVDA).
🔎 Features:
Live Daily % Change: Calculates the percentage change between today’s open and the current price.
Color Gradient: Background color intensity reflects the strength of the move (from mild to strong bullish/bearish).
Trend Arrows: Visual arrows 🔺 (up) and 🔻 (down) represent the direction of movement.
Position Mode Selector:
"Buy" – highlights with green tones
"Sell" – highlights with red tones
"Neutral" – uses dynamic coloring based on individual stock moves
📍 Placement:
The table is positioned in the top-right corner of the chart for easy reference without cluttering your main view.
Note di rilascio
✅ Update: Position Context Mode & Dynamic HighlightingThis update introduces a new "Position Type" selector, allowing traders to switch between Buy, Sell, and Neutral modes.
In Buy mode, bullish assets are highlighted with shades of green based on strength.
In Sell mode, bearish assets are emphasized using red gradients.
In Neutral mode, each stock is independently colored based on its own % change.
This enhancement provides a clearer visual focus aligned with your current market bias or trading strategy.
Script open-source
Nello spirito di TradingView, l'autore di questo script lo ha reso open source, in modo che i trader possano esaminarne e verificarne la funzionalità. Complimenti all'autore! Sebbene sia possibile utilizzarlo gratuitamente, ricordiamo che la ripubblicazione del codice è soggetta al nostro Regolamento.
Declinazione di responsabilità
Le informazioni e le pubblicazioni non sono intese come, e non costituiscono, consulenza o raccomandazioni finanziarie, di investimento, di trading o di altro tipo fornite o approvate da TradingView. Per ulteriori informazioni, consultare i Termini di utilizzo.