PROTECTED SOURCE SCRIPT
Aggiornato WSI FX Dashboard
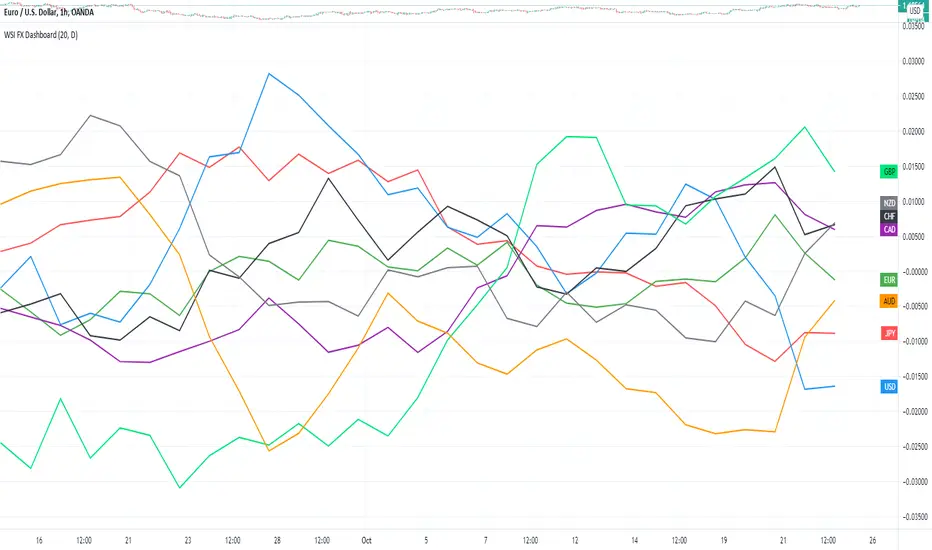
The WSI (Walton Strength Index) is a currency strength tool designed to show you how individual currencies are performing against each other.
It shows strength for 8 of the major currencies: USD, EUR, GBP, JPY, USD, CAD, AUD, NZD
Each of the lines corresponds to a currency, and you can use those readings to determine which currency pairs you would like to trade.
For example, if the EUR is higher than the rest of the currencies and the USD is lower than the rest of the currencies, then you may consider only buying on the EURUSD.
Don't look at this as an "entry mechanism" for placing trades, but rather a filter mechanism to help you determine which currency pairs might be best for a particular trading strategy that you intend to utilize. Once you have selected a currency pair, or set of currency pairs, then you would go to the individual currency pair charts and perform your usual technical analysis.
The Dashboard can be placed on any chart or timeframe. In the inputs you can select the timeframe you would like to use for the WSI calculations.
For example, if you are on a 1 hour chart and want to see a higher level view of the market, you might set the WSI Dashboard timeframe to Daily.
You can also change the WSI Period, which controls how many candles are used to calculate the strength for each currency.
Here is the 200 Period Daily WSI Dashboard:
Note di rilascio
There was an error in the code. It has been fixed now and should work as expected.Script protetto
Questo script è pubblicato come codice protetto. Tuttavia, è possibile utilizzarlo liberamente e senza alcuna limitazione – per saperne di più clicca qui.
Declinazione di responsabilità
Le informazioni ed i contenuti pubblicati non costituiscono in alcun modo una sollecitazione ad investire o ad operare nei mercati finanziari. Non sono inoltre fornite o supportate da TradingView. Maggiori dettagli nelle Condizioni d'uso.
Script protetto
Questo script è pubblicato come codice protetto. Tuttavia, è possibile utilizzarlo liberamente e senza alcuna limitazione – per saperne di più clicca qui.
Declinazione di responsabilità
Le informazioni ed i contenuti pubblicati non costituiscono in alcun modo una sollecitazione ad investire o ad operare nei mercati finanziari. Non sono inoltre fornite o supportate da TradingView. Maggiori dettagli nelle Condizioni d'uso.