OPEN-SOURCE SCRIPT
Aggiornato OTE & A-B-C Zone Indicator SwiftEdge
OTE & A-B-C Zone Indicator SwiftEdge
Overview
The OTE & A-B-C Zone Indicator SwiftEdge is a versatile tool designed to help traders identify high-probability trading setups using a combination of Optimal Trade Entry (OTE) zones, Fibonacci levels, and A-B-C price patterns. This indicator is particularly useful for traders who rely on price action and Fibonacci-based strategies to find entry points, set stop-losses, and target potential take-profit levels. By integrating swing point detection, trend analysis, and Fibonacci projections, SwiftEdge provides a clear visual framework for making informed trading decisions across various timeframes.
What It Does
SwiftEdge identifies key price levels and zones to guide your trading:
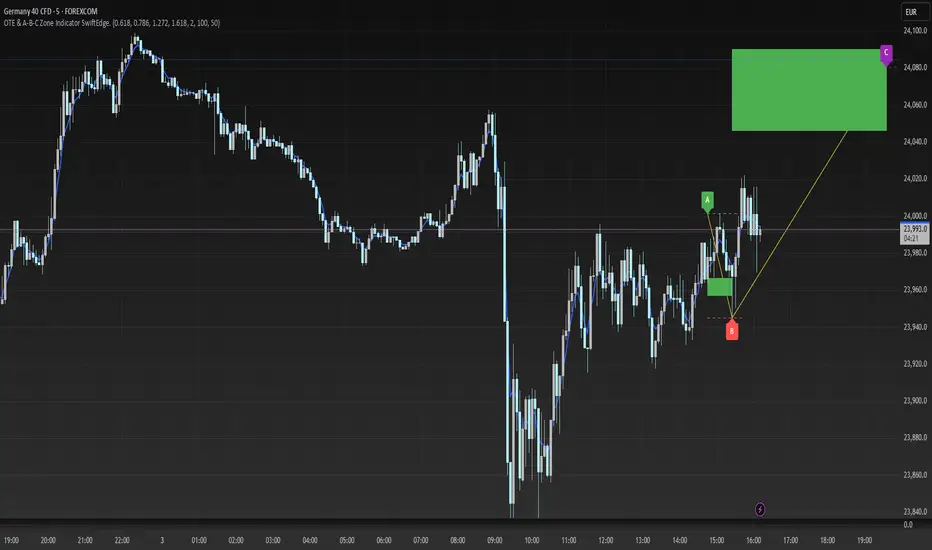
OTE Zone: Highlights the Optimal Trade Entry zone between swing points A (swing high) and B (swing low) using Fibonacci retracement levels (default: 0.618 to 0.786). This zone represents a high-probability area for price reversals, making it an ideal entry point for trades.
A-B-C Pattern: Marks the latest swing points as A (swing high), B (swing low), and C (projected take-profit level) with dashed lines and labels. A solid line connects A to B to C, visually illustrating the price movement from entry to target.
Take-Profit Zones: Projects three customizable take-profit levels (TP1, TP2, TP3) based on Fibonacci extensions (default: 1.272, 1.618, 2.0) from the A-B swing, helping traders plan exits with favorable risk-reward ratios.
How It Works
SwiftEdge combines several technical components to create a cohesive trading system:
Swing Point Detection: Identifies significant swing highs (A) and swing lows (B) using a dynamic lookback period that adjusts to the selected timeframe. On lower timeframes like 1-minute charts, an ATR-based filter reduces noise by requiring price movements to exceed a threshold (0.5 * ATR(14)).
Trend Analysis: Uses an Exponential Moving Average (EMA) to determine the trend direction (default: 50-period EMA on 1H). The indicator marks uptrends (price above EMA) in green and downtrends (price below EMA) in red, ensuring trades align with the market's direction.
Fibonacci Levels: Applies Fibonacci retracement to define the OTE zone between A and B, and Fibonacci extensions to project take-profit levels (C) beyond the initial swing. This approach leverages the natural tendency of markets to respect Fibonacci ratios for reversals and extensions.
Visual Clarity: Displays only the latest A-B-C pattern with three dashed lines (A, B, C) and a solid connecting line, ensuring the chart remains uncluttered and easy to interpret.
The combination of these elements creates a structured setup where the OTE zone (between A and B) serves as an entry point, while the projected C level offers a target, all within the context of the prevailing trend. This synergy makes SwiftEdge a powerful tool for traders seeking to combine price action, trend analysis, and Fibonacci strategies.
How to Use
Add the Indicator: Apply the indicator to your chart via TradingView's indicator menu.
Identify the Trend: The OTE zone and A-B-C pattern will be colored green in uptrends (price above EMA) or red in downtrends (price below EMA). Use this to determine the market direction.
Entry Point: Look for price reversals within the OTE zone (between A and B). This zone is typically between the 0.618 and 0.786 Fibonacci retracement levels of the A-B swing, making it a high-probability area for entries.
Stop-Loss: Place your stop-loss below the OTE zone in an uptrend (or above in a downtrend) to protect against false breakouts.
Take-Profit Targets: Use the projected take-profit zones (TP1, TP2, TP3) as potential exit levels. These are based on Fibonacci extensions and can be toggled on/off in the settings.
Customization:
Adjust the Fibonacci levels for the OTE zone (Fibonacci Level 1 and Fibonacci Level 2) to suit your strategy.
Modify the take-profit levels (Fibonacci Extension Level for TP1/TP2/TP3) to target different extension ratios.
Change the lookback period (Base Lookback Period) and EMA period (Base EMA Period) to fine-tune swing point detection and trend sensitivity.
Customize colors for uptrends, downtrends, and A-B-C lines to match your preferences.
What Makes It Unique
SwiftEdge stands out by integrating swing point detection, Fibonacci-based OTE zones, and A-B-C price patterns into a single, visually intuitive indicator. Unlike standalone Fibonacci tools or trend indicators, SwiftEdge combines these elements to provide a complete trading setup: it identifies entry zones (OTE), confirms trend direction (EMA), and projects take-profit targets (Fibonacci extensions). The dynamic timeframe adjustment ensures consistent performance across all chart intervals, while the clean A-B-C visualization (with only the latest pattern displayed) prevents chart clutter, making it easier to focus on the most relevant price levels.
Notes
This indicator is designed for traders familiar with price action and Fibonacci strategies. It does not guarantee profits and should be used in conjunction with other analysis tools and proper risk management.
Performance may vary depending on market conditions and timeframe. Test the indicator on a demo account before using it in live trading.
Overview
The OTE & A-B-C Zone Indicator SwiftEdge is a versatile tool designed to help traders identify high-probability trading setups using a combination of Optimal Trade Entry (OTE) zones, Fibonacci levels, and A-B-C price patterns. This indicator is particularly useful for traders who rely on price action and Fibonacci-based strategies to find entry points, set stop-losses, and target potential take-profit levels. By integrating swing point detection, trend analysis, and Fibonacci projections, SwiftEdge provides a clear visual framework for making informed trading decisions across various timeframes.
What It Does
SwiftEdge identifies key price levels and zones to guide your trading:
OTE Zone: Highlights the Optimal Trade Entry zone between swing points A (swing high) and B (swing low) using Fibonacci retracement levels (default: 0.618 to 0.786). This zone represents a high-probability area for price reversals, making it an ideal entry point for trades.
A-B-C Pattern: Marks the latest swing points as A (swing high), B (swing low), and C (projected take-profit level) with dashed lines and labels. A solid line connects A to B to C, visually illustrating the price movement from entry to target.
Take-Profit Zones: Projects three customizable take-profit levels (TP1, TP2, TP3) based on Fibonacci extensions (default: 1.272, 1.618, 2.0) from the A-B swing, helping traders plan exits with favorable risk-reward ratios.
How It Works
SwiftEdge combines several technical components to create a cohesive trading system:
Swing Point Detection: Identifies significant swing highs (A) and swing lows (B) using a dynamic lookback period that adjusts to the selected timeframe. On lower timeframes like 1-minute charts, an ATR-based filter reduces noise by requiring price movements to exceed a threshold (0.5 * ATR(14)).
Trend Analysis: Uses an Exponential Moving Average (EMA) to determine the trend direction (default: 50-period EMA on 1H). The indicator marks uptrends (price above EMA) in green and downtrends (price below EMA) in red, ensuring trades align with the market's direction.
Fibonacci Levels: Applies Fibonacci retracement to define the OTE zone between A and B, and Fibonacci extensions to project take-profit levels (C) beyond the initial swing. This approach leverages the natural tendency of markets to respect Fibonacci ratios for reversals and extensions.
Visual Clarity: Displays only the latest A-B-C pattern with three dashed lines (A, B, C) and a solid connecting line, ensuring the chart remains uncluttered and easy to interpret.
The combination of these elements creates a structured setup where the OTE zone (between A and B) serves as an entry point, while the projected C level offers a target, all within the context of the prevailing trend. This synergy makes SwiftEdge a powerful tool for traders seeking to combine price action, trend analysis, and Fibonacci strategies.
How to Use
Add the Indicator: Apply the indicator to your chart via TradingView's indicator menu.
Identify the Trend: The OTE zone and A-B-C pattern will be colored green in uptrends (price above EMA) or red in downtrends (price below EMA). Use this to determine the market direction.
Entry Point: Look for price reversals within the OTE zone (between A and B). This zone is typically between the 0.618 and 0.786 Fibonacci retracement levels of the A-B swing, making it a high-probability area for entries.
Stop-Loss: Place your stop-loss below the OTE zone in an uptrend (or above in a downtrend) to protect against false breakouts.
Take-Profit Targets: Use the projected take-profit zones (TP1, TP2, TP3) as potential exit levels. These are based on Fibonacci extensions and can be toggled on/off in the settings.
Customization:
Adjust the Fibonacci levels for the OTE zone (Fibonacci Level 1 and Fibonacci Level 2) to suit your strategy.
Modify the take-profit levels (Fibonacci Extension Level for TP1/TP2/TP3) to target different extension ratios.
Change the lookback period (Base Lookback Period) and EMA period (Base EMA Period) to fine-tune swing point detection and trend sensitivity.
Customize colors for uptrends, downtrends, and A-B-C lines to match your preferences.
What Makes It Unique
SwiftEdge stands out by integrating swing point detection, Fibonacci-based OTE zones, and A-B-C price patterns into a single, visually intuitive indicator. Unlike standalone Fibonacci tools or trend indicators, SwiftEdge combines these elements to provide a complete trading setup: it identifies entry zones (OTE), confirms trend direction (EMA), and projects take-profit targets (Fibonacci extensions). The dynamic timeframe adjustment ensures consistent performance across all chart intervals, while the clean A-B-C visualization (with only the latest pattern displayed) prevents chart clutter, making it easier to focus on the most relevant price levels.
Notes
This indicator is designed for traders familiar with price action and Fibonacci strategies. It does not guarantee profits and should be used in conjunction with other analysis tools and proper risk management.
Performance may vary depending on market conditions and timeframe. Test the indicator on a demo account before using it in live trading.
Note di rilascio
Updated Alerts for OTE zoneNote di rilascio
Updated alertsNote di rilascio
Alarms fixetScript open-source
Nello spirito di TradingView, l'autore di questo script lo ha reso open source, in modo che i trader possano esaminarne e verificarne la funzionalità. Complimenti all'autore! Sebbene sia possibile utilizzarlo gratuitamente, ricordiamo che la ripubblicazione del codice è soggetta al nostro Regolamento.
Declinazione di responsabilità
Le informazioni e le pubblicazioni non sono intese come, e non costituiscono, consulenza o raccomandazioni finanziarie, di investimento, di trading o di altro tipo fornite o approvate da TradingView. Per ulteriori informazioni, consultare i Termini di utilizzo.
Script open-source
Nello spirito di TradingView, l'autore di questo script lo ha reso open source, in modo che i trader possano esaminarne e verificarne la funzionalità. Complimenti all'autore! Sebbene sia possibile utilizzarlo gratuitamente, ricordiamo che la ripubblicazione del codice è soggetta al nostro Regolamento.
Declinazione di responsabilità
Le informazioni e le pubblicazioni non sono intese come, e non costituiscono, consulenza o raccomandazioni finanziarie, di investimento, di trading o di altro tipo fornite o approvate da TradingView. Per ulteriori informazioni, consultare i Termini di utilizzo.