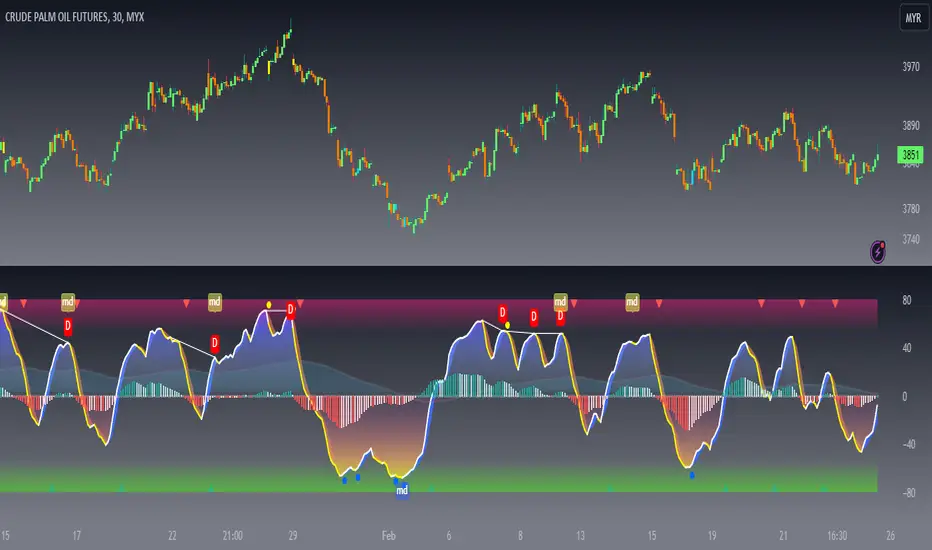
TREND CIRCLE + DIVERGENCES Oscillator

This indicator includes wave trend instruments, divergence detection, and additional moving average applications. Modification of this oscillator is of course to get better signals in the trading strategy. Make it as simple as possible. Glad to be informed that this indicator is NON-REPAINT.
I’m just modified Simple Reversal Point to facilitate the reversal zone and entry point.
Among the modified ones are;
1. I have changed the labels of buy/sell signals which are easier to see.
2. Translating input settings from Spanish to English to make it easier for traders( global ) to identify the input requirements they want to use.
Trend Circle Osc
The TC oscillator ( wave trend ) at following swings in a volatile market which is why this particular indicator is very useful when trading any market.
The horizontal background lines on the top and bottom of the indicator are similar to the overbought and oversold thresholds on the Stochastic RSI indicator. They show the areas at the strongest part of the trend, usually just before the reversal.
The key to this indicator is in the ranges.
• The strongest buy signals are given when the solid green circle appears in the horizontal green background.
• The strongest sell signal is given when the yellow circle appears in the horizontal red background.
Regular divergence
Regular divergence allows you to see a trend reversal or continuation. This is the best signal to make decisions to sell short or buy long.
Divergence can only be evaluated when the price either formed :
• A higher high than the previous high
• A lower low than the previous low
• Double top
• Double bottom
The price chart will prepare for a downward movement if the divergence is bearish. It’s shown by a red RD signal. You should prepare for selling. When there is a bullish divergence, a green RD signal is shown, it’s worth getting ready to buy, as the chart will go up.
The key to bearish/bullish divergence;
Regular Bearish Divergence ( Red RD signals )
To identify bearish divergence in the market, a trader must look at the highs of the price (shadows of candles) and the corresponding indicator. A classic bearish divergence will occur when certain conditions are met: a high should appear on the price chart, and the indicator should show a lower high. Then a Red RD signal appears.
Regular Bullish Divergence ( Green RD signals )
To determine the classic bullish divergence, you should pay attention to the lows of the chart, as well as the indicator. If the market has a regular bullish divergence, then the candlesticks will draw a lower price value, and the indicator, on the contrary, will draw a higher low. Then a Green RD appears. We should expect an upward movement; that is, the trader needs to get ready to buy.
Trendline + MA cross-over/under > scalping set-up
This indicator is also equipped with a MA trendline specifically for scalping strategies. The MA line is shown by the green (bullish) and red (bearish) colored lines
The key to this setup ;
• Entry buy/long when MA cross-over the trendline
• Entry sell/short when MA cross-under the trendline
Strong buy/sell signals
You can get a strong signal when both Red/Yellow and red/green RD signals come out together. There is the best confirmation for the reversal of the trend.
DISCLAIMER:
All technical signals and strategies using this indicator are for educational purposes. Take it at your own risk.
Script su invito
L'accesso a questo script è riservato agli utenti autorizzati dall'autore, solitamente dietro pagamento di una commissione. Puoi aggiungerlo ai preferiti, ma sarai in grado di utilizzarlo solo una volta ricevuto il via libera da parte dell'autore. Per ulteriori informazioni, contatta TraderAsist o segui le istruzioni dell'autore riportate di seguito.
Si prega di notare che questo è uno script privato, ad invito, che non è stato analizzato dai moderatori degli script. La sua conformità al Regolamento è da considerarsi imprecisata. TradingView non suggerisce di pagare per uno script e di utilizzarlo a meno che non ci si fidi al 100% del suo autore e non si comprenda il suo funzionamento. In molti casi, è possibile trovare gratuitamente una buona alternativa open-source nei nostri Script della comunità.