KRI For Loop | QuantumResearch
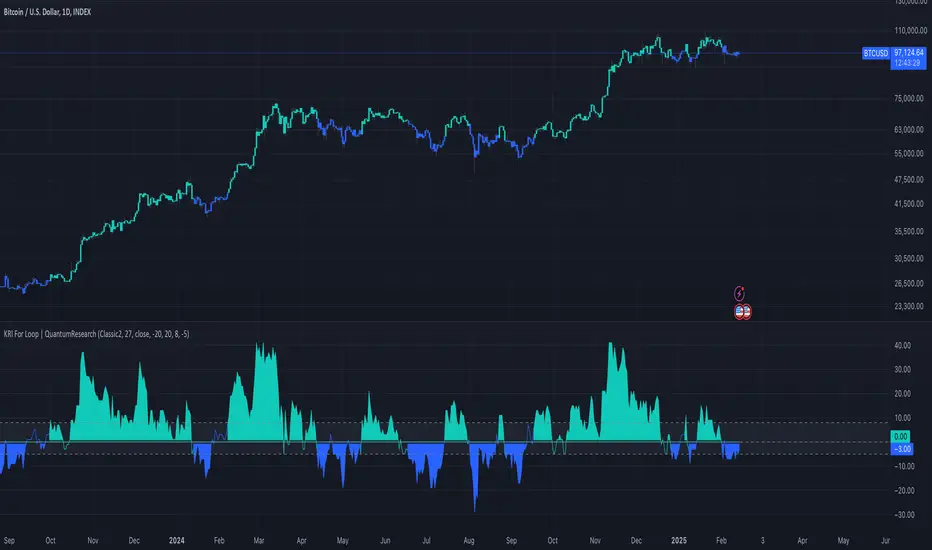
The KRI For Loop indicator is an advanced trend-following tool that enhances the traditional Kairi Relative Index (KRI) with a for-loop scoring mechanism. The Kairi Relative Index (KRI) measures the percentage deviation of price from its smoothed moving average, helping traders identify market trends and reversals. By incorporating a for-loop calculation, this version refines trend detection, making it a powerful tool for traders seeking precise entry and exit points.
- Understanding the KRI For Loop
The Kairi Relative Index (KRI) is a momentum-based indicator that calculates how far the current price deviates from its moving average, expressed as a percentage. It is widely used to identify overbought and oversold conditions, as well as potential trend reversals.
In this enhanced version, a for-loop scoring mechanism systematically evaluates KRI values within a defined range to determine trend strength:
KRI Calculation: The formula computes the percentage difference between price and an Exponential Moving Average (EMA) of a user-defined length.
For-Loop Scoring: A dynamic scoring system assesses the strength of KRI values across a range (default: -20 to 20), helping to refine market trend analysis. - Threshold-Based Signal Generation:
Long Signal: Triggered when the for-loop score surpasses the long threshold (default: 8).
Short Signal: Triggered when the score falls below the short threshold (default: -5). - Visual Representation
The KRI For Loop indicator provides a clear, color-coded trend analysis:
Green Bars: Indicate bullish conditions when the score surpasses the long threshold, signaling a potential buy opportunity.
Red Bars: Indicate bearish conditions when the score drops below the short threshold, suggesting a sell opportunity.
Gray Bars: Show neutral conditions when the score remains within the defined range.
KRI Bands: Three horizontal bands help visualize market structure:
Upper Band: Represents the bullish threshold.
Middle Band: Zero line for neutral conditions.
Lower Band: Represents the bearish threshold.
Background Fill: A shaded area between the bands highlights trend intensity.
Customization & Parameters - The KRI For Loop indicator offers multiple user-configurable settings for flexibility:
KRI Length: Default set to 27, determines the EMA smoothing period.
Source Price: Selectable input price for calculations (default: close).
Scoring Range (a, b): Defines the range of KRI values assessed in the for-loop (default: -20 to 20). - Long & Short Thresholds:
Long Threshold: Default set to 8, determines when bullish conditions are strong enough for a buy signal.
Short Threshold: Default set to -5, identifies bearish conditions for sell signals. - Color Modes: Choose from eight distinct color schemes to personalize the indicator’s appearance.
- Trading Applications
This indicator is highly adaptable and can be applied to various trading strategies, including:
Momentum Trading: Evaluates trend strength based on KRI deviation and for-loop scoring.
Trend Following: Helps traders stay in profitable trends by identifying strong bullish and bearish conditions.
Reversal Detection: The crossing of key KRI thresholds can signal potential market reversals.
Risk Management: Clearly defined entry and exit rules help traders manage risk effectively. - Final Note
Rocheur’s KRI For Loop indicator combines the power of the Kairi Relative Index (KRI) with an advanced for-loop scoring method to deliver a refined market trend analysis. This structured approach offers traders a dynamic and visually intuitive tool for detecting momentum shifts and trend reversals. As always, backtesting and strategic adjustments are essential to fully optimize this indicator for real-world trading.
Script su invito
Solo gli utenti approvati dall'autore possono accedere a questo script. È necessario richiedere e ottenere l'autorizzazione per utilizzarlo. Tale autorizzazione viene solitamente concessa dopo il pagamento. Per ulteriori dettagli, seguire le istruzioni dell'autore riportate di seguito o contattare direttamente QuantumResearch.
TradingView NON consiglia di acquistare o utilizzare uno script a meno che non si abbia piena fiducia nel suo autore e se ne comprenda il funzionamento. È inoltre possibile trovare alternative gratuite e open source nei nostri script della community.
Istruzioni dell'autore
whop.com/quantum-whop/
⚒️ Get access to our toolbox here for free:
quantumresearchportfolio.carrd.co
All tools and content provided are for informational and educational purposes only.
Declinazione di responsabilità
Script su invito
Solo gli utenti approvati dall'autore possono accedere a questo script. È necessario richiedere e ottenere l'autorizzazione per utilizzarlo. Tale autorizzazione viene solitamente concessa dopo il pagamento. Per ulteriori dettagli, seguire le istruzioni dell'autore riportate di seguito o contattare direttamente QuantumResearch.
TradingView NON consiglia di acquistare o utilizzare uno script a meno che non si abbia piena fiducia nel suo autore e se ne comprenda il funzionamento. È inoltre possibile trovare alternative gratuite e open source nei nostri script della community.
Istruzioni dell'autore
whop.com/quantum-whop/
⚒️ Get access to our toolbox here for free:
quantumresearchportfolio.carrd.co
All tools and content provided are for informational and educational purposes only.