OPEN-SOURCE SCRIPT
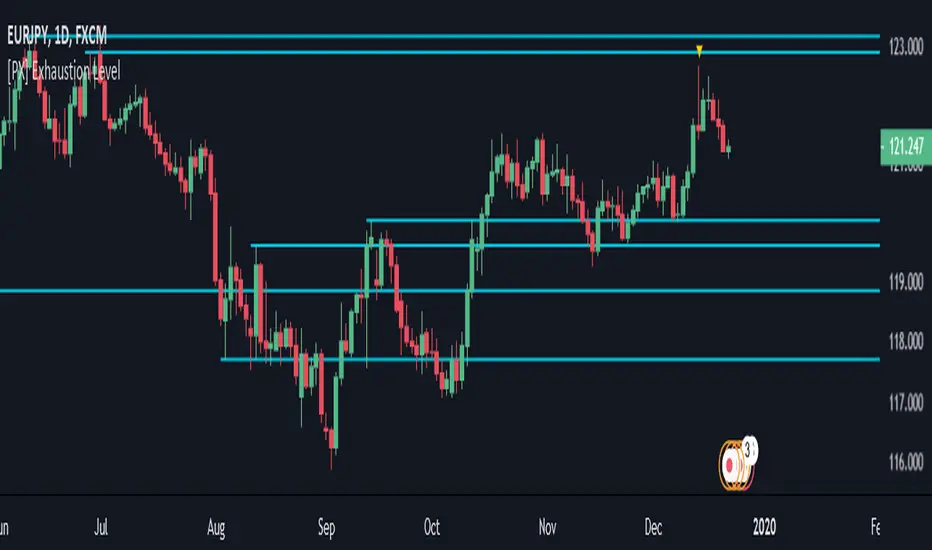
[PX] Exhaustion Level
Hello guys,
I love to play around with different methods for detecting support and resistance level. So today here is a new approach, which could be interesting to a few of you. I call it exhaustion level.
I'll give a brief introduction on how the indicator works and leave the testing/applying to you.
How does it work?
The method is basically very simple. The indicator constantly keeps track of the difference between the current close and the VWAP. The detected value will then be normalized and therefore put into comparison to it's previous "n" candles. (You decide yourself which value will be used for "n" by setting the "Length"-parameter in the settings tab.)
Once the normalized value equals "1", the price movement is considered to be somewhat overheated and the indicator starts plotting a level at the current high. The level will continually change until the movement goes the opposite way. Then it will settle and change its color.
The same approach takes place when the normalized value reaches "0", this time plotting a level at the low.
I hope some of you will find it useful and if so, please leave a "like" :)
Have fun, happy trading and merry Christmas :)))
Script open-source
Nello spirito di TradingView, l'autore di questo script lo ha reso open source, in modo che i trader possano esaminarne e verificarne la funzionalità. Complimenti all'autore! Sebbene sia possibile utilizzarlo gratuitamente, ricordiamo che la ripubblicazione del codice è soggetta al nostro Regolamento.
🙋♂️Listed as "Trusted Pine Programmer for Hire"
💰Save $30 on your Tradingview subscription: bit.ly/3OtLyNz
🔓Indicator access: dize-trading.de/
🔒Trial access: discord.gg/DqwKjBZ8Qe
💰Save $30 on your Tradingview subscription: bit.ly/3OtLyNz
🔓Indicator access: dize-trading.de/
🔒Trial access: discord.gg/DqwKjBZ8Qe
Declinazione di responsabilità
Le informazioni e le pubblicazioni non sono intese come, e non costituiscono, consulenza o raccomandazioni finanziarie, di investimento, di trading o di altro tipo fornite o approvate da TradingView. Per ulteriori informazioni, consultare i Termini di utilizzo.