OPEN-SOURCE SCRIPT
Aggiornato Show Daily Candles on Intraday Chart
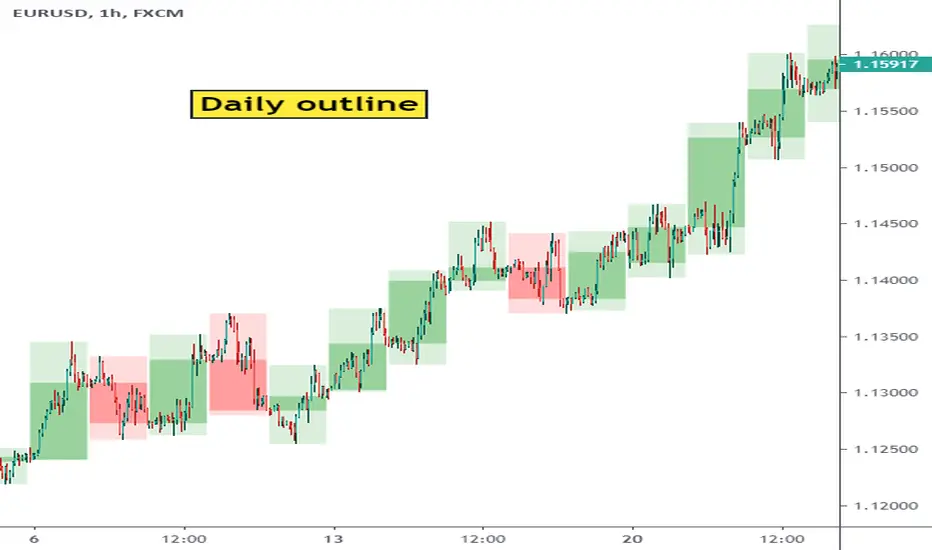
This script shows daily candle outlines on intraday periods. You can use this to simultaneously see what is happening on 'the bigger picture' without changing timeframe.
To address Tradingview moderation comments - this script only shows the outlines of completed days. So the most recent candle outline the indicator will show is yesterday.
I've not used the indicator in live trading yet so I don't know whether its going to be of useful to me yet but it was easy to code so I thought I'd give it a go. (Perhaps it will useful to people on the free tradingview subscription who have limited multi-chart options)
Note di rilascio
Does not function properly below 10 min periods so i deactivated it if you're on that timeframe. Pinescript does not seem to be able to look back more than 1000 bars so the script can not find where the day starts on the low timeframes...
Note di rilascio
other update had wrong image...Note di rilascio
You can now show Weekly and Monthly candles. Use the indicator options tabScript open-source
Nello spirito di TradingView, l'autore di questo script lo ha reso open source, in modo che i trader possano esaminarne e verificarne la funzionalità. Complimenti all'autore! Sebbene sia possibile utilizzarlo gratuitamente, ricordiamo che la ripubblicazione del codice è soggetta al nostro Regolamento.
Declinazione di responsabilità
Le informazioni e le pubblicazioni non sono intese come, e non costituiscono, consulenza o raccomandazioni finanziarie, di investimento, di trading o di altro tipo fornite o approvate da TradingView. Per ulteriori informazioni, consultare i Termini di utilizzo.
Script open-source
Nello spirito di TradingView, l'autore di questo script lo ha reso open source, in modo che i trader possano esaminarne e verificarne la funzionalità. Complimenti all'autore! Sebbene sia possibile utilizzarlo gratuitamente, ricordiamo che la ripubblicazione del codice è soggetta al nostro Regolamento.
Declinazione di responsabilità
Le informazioni e le pubblicazioni non sono intese come, e non costituiscono, consulenza o raccomandazioni finanziarie, di investimento, di trading o di altro tipo fornite o approvate da TradingView. Per ulteriori informazioni, consultare i Termini di utilizzo.