OPEN-SOURCE SCRIPT
Aggiornato Correlation Table
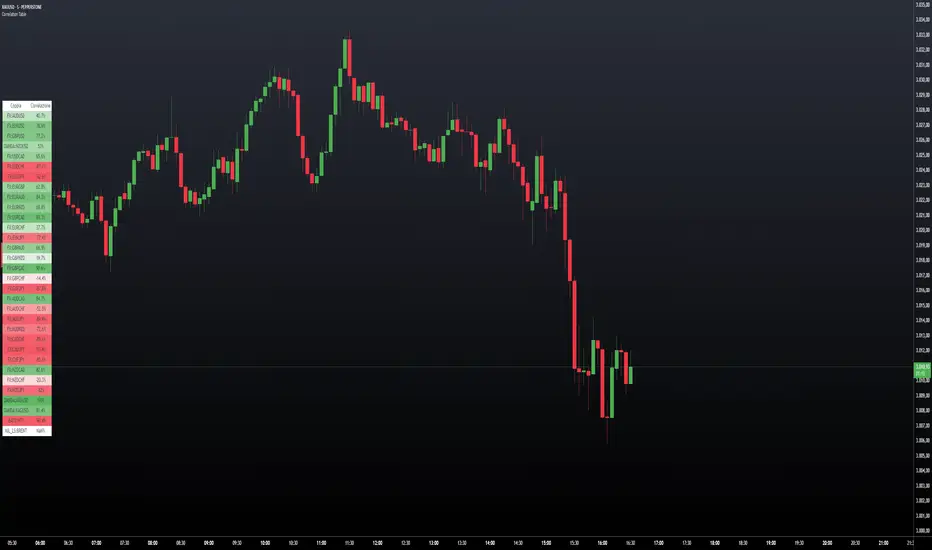
This indicator displays a vertical table that shows the correlation between the asset currently loaded on the chart and up to 32 selected trading pairs. It offers the following features:
Chart-Based Correlation: Correlations are calculated based on the asset you have loaded in your chart, providing relevant insights for your current market focus.
Configurable Pairs: Choose from a list of 32 symbols (e.g., AUDUSD, EURUSD, GBPUSD, etc.) with individual checkboxes to include or exclude each pair in the correlation analysis.
Custom Correlation Length: Adjust the lookback period for the correlation calculation to suit your analysis needs.
Optional EMA Smoothing: Enable an Exponential Moving Average (EMA) on the price data, with a configurable EMA length, to smooth the series before calculating correlations.
Color-Coded Output: The table cells change color based on the correlation strength and direction—neutral, bullish (green), or bearish (red)—making it easy to interpret at a glance.
Clear Table Layout: The indicator outputs a neatly organized vertical table with headers for "Pair" and "Correlation," ensuring the information is displayed cleanly and is easy to understand.
Ideal for traders who want a quick visual overview of how different instruments correlate with their current asset, this tool supports informed multi-asset analysis
ITALIANO:
Questo indicatore visualizza una tabella verticale che mostra la correlazione tra l'asset attualmente caricato sul grafico e fino a 32 coppie di trading selezionate. Offre le seguenti funzionalità:
Correlazione basata sul grafico: le correlazioni vengono calcolate in base all'asset caricato nel grafico, fornendo informazioni pertinenti per il tuo attuale focus di mercato.
Coppie configurabili: scegli da un elenco di 32 simboli (ad esempio, AUDUSD, EURUSD, GBPUSD, ecc.) con caselle di controllo individuali per includere o escludere ciascuna coppia nell'analisi della correlazione.
Lunghezza di correlazione personalizzata: regola il periodo di lookback per il calcolo della correlazione in base alle tue esigenze di analisi.
Smoothing EMA opzionale: abilita una media mobile esponenziale (EMA) sui dati dei prezzi, con una lunghezza EMA configurabile, per smussare la serie prima di calcolare le correlazioni.
Output codificato a colori: le celle della tabella cambiano colore in base alla forza e alla direzione della correlazione, neutra, rialzista (verde) o ribassista (rosso), rendendola facile da interpretare a colpo d'occhio.
Clear Table Layout: l'indicatore genera una tabella verticale ordinatamente organizzata con intestazioni per "Coppia" e "Correlazione", assicurando che le informazioni siano visualizzate in modo chiaro e siano facili da comprendere.
Ideale per i trader che desiderano una rapida panoramica visiva di come diversi strumenti siano correlati con il loro asset corrente, questo strumento supporta un'analisi multi-asset informata
Note di rilascio
Here is a summary of the improvements made to the correlation indicator:Optimized Default Pairs:
Set 11 major forex pairs as active by default:
-EURUSD
-USDCHF
-USDCAD
-NZDJPY
-AUDJPY
-NZDUSD
-AUDUSD
-GBPJPY
-GBPUSD
-USDJPY
-CADJPY
Other pairs available but disabled by default
Sort System:
Added the ability to sort correlations in:
-Ascending order
-Descending order
-Custom order (default)
-Fixed the ConcurrentModificationException issue in sorting
Improved Documentation:
-Added bilingual tooltip (Italian/English) for the Correlation Length parameter
-Clear explanation of how the correlation calculation works
-Practical example with timeframes (e.g. M5 with 50 periods = 250 minutes)
User Interface:
-Cleaner and more organized layout
-View options customizable for each pair
-Adjustable table size (Large, Medium, Small)
These improvements make the indicator more user-friendly and functional for analyzing correlations between forex pairs.
Note di rilascio
The main changes are:- Moved array declaration outside the "if" block
- Added "array.clear()" to clear arrays before filling them
- Removed "var" from array declaration inside the block
Note di rilascio
I made several key changes to make the code more stable, particularly in sorting management. Here are the main modifications:1. **New Sorting Approach**:
sort_pairs(pairs) =>
if sortType != 'Personalizzato'
n = array.size(pairs)
sorted = array.new<PairData>() // Create a new array instead of modifying the existing one
// First copy all values
for i = 0 to n - 1
array.push(sorted, array.get(pairs, i))
- Instead of modifying the original array, we create a new `sorted` array
- first copy all values into this new array
- This prevents modifications to the array while we're reading it
2. **Improved Sorting Algorithm**:
// Selection sort instead of bubble sort
for i = 0 to n - 2
minIdx = i
for j = i + 1 to n - 1
curr = array.get(sorted, minIdx)
next = array.get(sorted, j)
shouldSwap = sortType == 'Crescente' ? curr.correlation > next.correlation : curr.correlation < next.correlation
if shouldSwap
minIdx := j
- implemented selection sort instead of bubble sort
- This algorithm is more stable because it makes fewer swaps
- keep track of the minimum index instead of continuously swapping elements
3. **Safer Swap Management**:
if minIdx != i
temp = array.get(sorted, i)
array.set(sorted, i, array.get(sorted, minIdx))
array.set(sorted, minIdx, temp)
- Swaps are only made when necessary (minIdx != i)
- use a temporary variable for swapping
- This makes the operation safer and prevents data corruption
4. **Clearer Data Flow**:
if barstate.islast
pairs = get_pairs_data() // 1. Get data
sorted_pairs = sort_pairs(pairs) // 2. Sort data safely
update_table(sorted_pairs) // 3. Update table with sorted data
- made the data flow clearer
- Each operation has a specific and well-defined purpose
- The original array remains intact while we work on a sorted copy
These changes have made the code more stable because:
- We avoid concurrent modifications to arrays
- We use a more robust sorting algorithm
- We maintain a clear separation between original and sorted data
- We reduce the risk of data corruption during sorting
Note di rilascio
Renamed the indicator correctlyNote di rilascio
Summary of Updates1. Replaced Custom Correlation Function with Native Pine Script Function
- The previous custom function was removed.
- Now, the script uses the native and more reliable Pine Script function:
ta.correlation(close, closeX, length)
2. Data Request Simplification
- The `get_close` function now always returns the closing price of the selected symbol:
get_close(symbol) =>
request.security(symbol, timeframe.period, close)
3. Consistent Correlation Calculation
- For each pair, the correlation is now calculated as:
corrX = ta.correlation(close, closeX, length)
---
Result:
The Correlation Table now provides correlation values that are fully aligned with TradingView’s standards and with your Money Flow indicator, improving reliability and comparability.
Italiano:
Riepilogo degli aggiornamenti
1. Funzione di correlazione personalizzata sostituita con la funzione nativa di Pine Script
- La precedente funzione personalizzata è stata rimossa.
- Ora lo script utilizza la funzione nativa e più affidabile di Pine Script:
ta.correlation(close, closeX, length)
2. Semplificazione della richiesta dati
- La funzione `get_close` ora restituisce sempre il prezzo di chiusura del simbolo selezionato:
get_close(symbol) =>
request.security(symbol, timeframe.period, close)
3. Calcolo della correlazione coerente
- Per ogni coppia, la correlazione viene ora calcolata come:
corrX = ta.correlation(close, closeX, length)
---
Risultato:
La tabella di correlazione ora fornisce valori di correlazione completamente allineati con gli standard di TradingView e con l'indicatore Money Flow, migliorando l'affidabilità e la comparabilità.
Note di rilascio
Added the ability to position the table in different places, such as: in the corners, in the middle, right or leftScript open-source
Nello spirito di TradingView, l'autore di questo script lo ha reso open source, in modo che i trader possano esaminarne e verificarne la funzionalità. Complimenti all'autore! Sebbene sia possibile utilizzarlo gratuitamente, ricordiamo che la ripubblicazione del codice è soggetta al nostro Regolamento.
Declinazione di responsabilità
Le informazioni e le pubblicazioni non sono intese come, e non costituiscono, consulenza o raccomandazioni finanziarie, di investimento, di trading o di altro tipo fornite o approvate da TradingView. Per ulteriori informazioni, consultare i Termini di utilizzo.
Script open-source
Nello spirito di TradingView, l'autore di questo script lo ha reso open source, in modo che i trader possano esaminarne e verificarne la funzionalità. Complimenti all'autore! Sebbene sia possibile utilizzarlo gratuitamente, ricordiamo che la ripubblicazione del codice è soggetta al nostro Regolamento.
Declinazione di responsabilità
Le informazioni e le pubblicazioni non sono intese come, e non costituiscono, consulenza o raccomandazioni finanziarie, di investimento, di trading o di altro tipo fornite o approvate da TradingView. Per ulteriori informazioni, consultare i Termini di utilizzo.