EDGE Momentum Cloud
EDGE MOMENTUM CLOUD
═════════════════════════════════════════════════════════════
█ OVERVIEW
The EDGE Momentum Cloud is a confluence-based trading system that combines adaptive volatility zones with trend direction analysis to identify high-probability trade setups. Rather than relying on a single indicator, this tool creates a visual "momentum zone" that helps traders understand the current market regime while filtering signals through trend confirmation.
The indicator generates two tiers of signals:
• Standard Signals — Based on trend direction changes
• Premium Signals — Require additional confluence with momentum zone positioning
Premium signals represent higher-conviction setups where multiple factors align.
█ HOW IT WORKS
The EDGE Momentum Cloud combines two core components working together:
❶ MOMENTUM ZONE (CLOUD)
Two ATR-based trailing bands create a dynamic volatility envelope
❷ TREND FILTER
A customizable moving average determines trend direction
❸ SIGNAL ENGINE
Evaluates confluence between trend changes and zone positioning
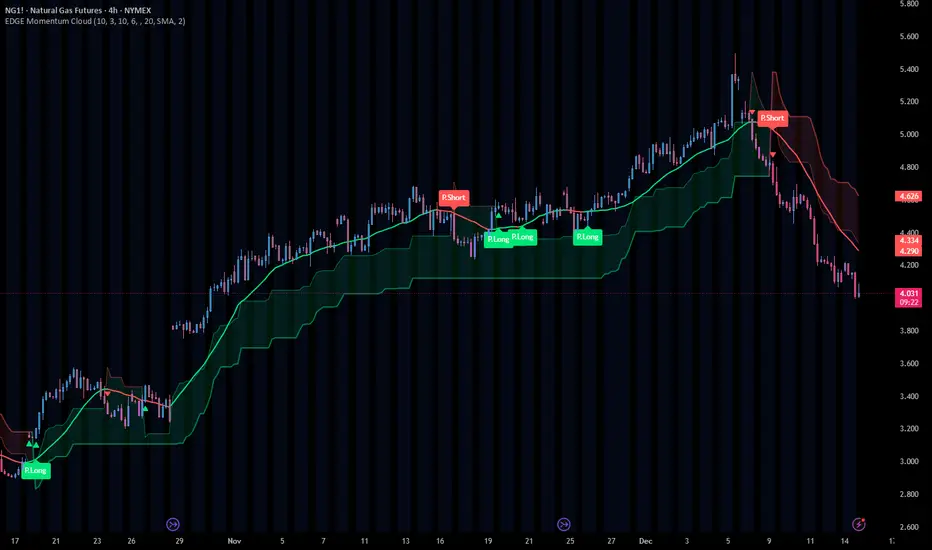
█ THE MOMENTUM ZONE EXPLAINED
At the core of this indicator are two ATR-based trailing bands that form the "momentum zone":
INNER BAND (FAST)
• Tighter trailing stop using a smaller ATR multiplier (default: 3.0×)
• Reacts quickly to price changes
• Defines the near-term momentum boundary
OUTER BAND (SLOW)
• Wider trailing stop using a larger ATR multiplier (default: 6.0×)
• Provides a more forgiving boundary
• Represents the broader momentum envelope
The space between these bands creates the Momentum Zone—a visual cloud that expands during volatile conditions and contracts during consolidation.
ZONE COLOR INTERPRETATION:
• Green Zone = Bullish bias (bands trailing below price)
• Red Zone = Bearish bias (bands trailing above price)
█ THE TREND FILTER EXPLAINED
A customizable moving average acts as the trend direction filter. When the trend line changes direction (turns up or down), the indicator evaluates whether conditions support a trade signal.
The trend filter supports 13 different calculation methods, allowing you to match the indicator's responsiveness to your trading style:
SMA • EMA • WMA • HMA • VWMA • RMA • LSMA
TMA • DEMA • TEMA • DWMA • SSMA • MEDIAN
Direction is determined by comparing the current value to a previous value (controlled by Direction Smoothing). Higher smoothing values reduce noise and false direction changes.
█ SIGNAL LOGIC
┌────────────────────────────────────────────────────────────
│ STANDARD SIGNALS
├────────────────────────────────────────────────────────────
│ These trigger when the trend filter changes direction:
│
│ LONG — Trend filter turns from falling to rising
│ SHORT — Trend filter turns from rising to falling
│
│ Standard signals indicate a potential trend change but
│ do not require zone confluence.
└────────────────────────────────────────────────────────────
┌────────────────────────────────────────────────────────────
│ PREMIUM SIGNALS
├────────────────────────────────────────────────────────────
│ These require confluence between trend change AND
│ favorable positioning relative to the momentum zone:
│
│ PREMIUM LONG
│ • Trend turns up while filter is ABOVE the zone, OR
│ • Price breaks into/out of zone during recent bullish trigger
│
│ PREMIUM SHORT
│ • Trend turns down while filter is BELOW the zone, OR
│ • Price breaks into/out of zone during recent bearish trigger
│
│ Premium signals have built-in confluence and typically
│ offer better risk/reward setups.
└────────────────────────────────────────────────────────────
█ VISUAL ELEMENTS
ZONE COMPONENTS
• Inner Band — Fast trailing stop (thin line)
• Outer Band — Slow trailing stop (thick line)
• Zone Fill — Shaded area between bands showing momentum regime
TREND COMPONENTS
• Trend Line — Moving average with slope-based coloring
• Green = Rising trend
• Red = Falling trend
• Purple = Neutral (if color by direction disabled)
SIGNAL MARKERS
• Triangle Up + "Long" — Standard long signal
• Triangle Down + "Short" — Standard short signal
• Label Up + "P.Long" — Premium long signal
• Label Down + "P.Short" — Premium short signal
CROSS MARKERS
• Small triangles appear when price crosses the inner or outer bands
• Up triangles = Price crossing above band
• Down triangles = Price crossing below band
BAR COLORING
• Teal bars = Price above the zone (bullish territory)
• Pink bars = Price below the zone (bearish territory)
• Purple bars = Price inside the zone (transitional)
█ CONFIGURABLE SETTINGS
┌────────────────────────────────────────────────────────────
│ GENERAL SETTINGS
├────────────────────────────────────────────────────────────
│ Confirmed Signals Only (Default: ON)
│ • When enabled, signals wait for bar close before triggering
│ • Prevents repainting on live bars
│ • Recommended: Keep ON for live trading
│
│ Display Standard Signals (Default: ON)
│ • Show/hide basic trend-change signals
│
│ Display Premium Signals (Default: ON)
│ • Show/hide confluence-based signals
│
│ Tint Price Bars (Default: ON)
│ • Color bars based on position relative to zone
└────────────────────────────────────────────────────────────
┌────────────────────────────────────────────────────────────
│ MOMENTUM ZONE SETTINGS
├────────────────────────────────────────────────────────────
│ Fast ATR Length (Default: 10)
│ • Lookback period for inner band's ATR calculation
│ • Lower = More reactive to recent volatility
│ • Higher = Smoother, less reactive
│
│ Fast Band Factor (Default: 3.0)
│ • Multiplier for inner band distance from price
│ • Lower = Tighter band, more signals
│ • Higher = Wider band, fewer signals
│
│ Slow ATR Length (Default: 10)
│ • Lookback period for outer band's ATR calculation
│
│ Slow Band Factor (Default: 6.0)
│ • Multiplier for outer band distance from price
│ • Should be larger than Fast Band Factor
│ • Creates the width of the momentum zone
└────────────────────────────────────────────────────────────
┌────────────────────────────────────────────────────────────
│ TREND FILTER SETTINGS
├────────────────────────────────────────────────────────────
│ Display Trend Line (Default: ON)
│ • Show/hide the moving average line
│
│ Resolution (Default: Chart Timeframe)
│ • Timeframe for MA calculation
│ • Leave blank to use current chart timeframe
│ • Set higher timeframe for broader trend alignment
│
│ Lookback Period (Default: 20)
│ • Moving average period length
│ • Lower = Faster, more signals
│ • Higher = Slower, fewer signals
│
│ Calculation Method (Default: SMA)
│ • Choose from 13 MA types
│ • HMA and TEMA are faster/more responsive
│ • SMA and TMA are slower/smoother
│
│ Direction Smoothing (Default: 2)
│ • Bars to look back for slope comparison
│ • Higher values reduce false direction changes
│ • Range: 1-10
│
│ Color By Direction (Default: ON)
│ • Color the trend line based on its slope
└────────────────────────────────────────────────────────────
┌────────────────────────────────────────────────────────────
│ VISUAL SETTINGS
├────────────────────────────────────────────────────────────
│ Bullish Color — Color for bullish elements (default: green)
│ Bearish Color — Color for bearish elements (default: red)
│ Neutral Color — Color for neutral/transitional states
│ Zone Fill — Opacity for the momentum zone fill
└────────────────────────────────────────────────────────────
█ ALERTS
This indicator includes five configurable alerts:
① STANDARD LONG
Triggers on basic bullish trend change signal
② STANDARD SHORT
Triggers on basic bearish trend change signal
③ PREMIUM LONG
Triggers on high-confluence bullish signal
④ PREMIUM SHORT
Triggers on high-confluence bearish signal
⑤ ANY SIGNAL
Triggers on any of the above conditions
To enable alerts:
1. Right-click on the indicator → "Add Alert"
2. Select the condition you want to be alerted on
3. Configure notification method (popup, email, webhook, etc.)
█ RECOMMENDED USAGE
TIMEFRAME
• Works on any timeframe
• Lower timeframes (1m-15m) generate more signals
• Higher timeframes (1H-Daily) generate fewer, higher-quality signals
BEST PRACTICES
• Keep "Confirmed Signals Only" enabled for live trading
• Premium signals typically offer better risk/reward than Standard
• Use zone position as context—bullish setups above zone, bearish below
• Consider higher timeframe resolution for trend filter to align with broader trend
• Combine with support/resistance or supply/demand for complete trade plans
INTERPRETATION TIPS
• Wide zones suggest increased volatility
• Narrow zones suggest consolidation
• Cross markers at bands can serve as early warnings of regime changes
• Bar colors provide quick visual reference of market position
█ SIGNAL QUALITY GUIDE
┌─────────────────┬────────────────────────────────────────┐
│ HIGHEST QUALITY │ Premium signal + Price clearly │
│ │ positioned on correct side of zone │
├─────────────────┼────────────────────────────────────────┤
│ GOOD QUALITY │ Premium signal + Price inside zone │
├─────────────────┼────────────────────────────────────────┤
│ MODERATE │ Standard signal + Price on correct │
│ │ side of zone │
├─────────────────┼────────────────────────────────────────┤
│ LOWER QUALITY │ Standard signal + Price on wrong │
│ │ side or inside zone │
└─────────────────┴────────────────────────────────────────┘
█ Final Note
This Indicator was designed specifically for the ATR cloud and the levels it provides. The buy and sell signals are a byproduct of development but more of a secondary feature. This product is published so you can take advantage of the proprietary calculations we used to make our own ATR cloud that provides excellent areas of support and resistance.
PLEASE NOTE: The "EDGE MTF ATR Bias Matrix" study that supplies the table notifying you of support and resistance is made through these ATR calculations and would pair perfectly with this study.
█ DISCLAIMER
This indicator is provided for educational and informational purposes only. It is not financial advice and should not be construed as a recommendation to buy or sell any financial instrument.
The signals generated by this indicator are based on technical analysis calculations and do not guarantee any specific outcome. Always conduct your own analysis and use proper risk management.
Script su invito
Solo gli utenti approvati dall'autore possono accedere a questo script. È necessario richiedere e ottenere l'autorizzazione per utilizzarlo. Tale autorizzazione viene solitamente concessa dopo il pagamento. Per ulteriori dettagli, seguire le istruzioni dell'autore riportate di seguito o contattare direttamente RyanBaileyEdge.
TradingView NON consiglia di acquistare o utilizzare uno script a meno che non si abbia piena fiducia nel suo autore e se ne comprenda il funzionamento. È inoltre possibile trovare alternative gratuite e open source nei nostri script della community.
Istruzioni dell'autore
S&P Edge
Declinazione di responsabilità
Script su invito
Solo gli utenti approvati dall'autore possono accedere a questo script. È necessario richiedere e ottenere l'autorizzazione per utilizzarlo. Tale autorizzazione viene solitamente concessa dopo il pagamento. Per ulteriori dettagli, seguire le istruzioni dell'autore riportate di seguito o contattare direttamente RyanBaileyEdge.
TradingView NON consiglia di acquistare o utilizzare uno script a meno che non si abbia piena fiducia nel suo autore e se ne comprenda il funzionamento. È inoltre possibile trovare alternative gratuite e open source nei nostri script della community.
Istruzioni dell'autore
S&P Edge