OPEN-SOURCE SCRIPT
💻 RSI Dual-Band Reversal Strategy (Hacker Mode)
This 💻 RSI Dual-Band Reversal Strategy (Hacker Mode) is a mean-reversion trading strategy built on the Relative Strength Index (RSI) indicator.
It identifies potential trend reversals when price momentum reaches extreme overbought or oversold levels — then enters trades expecting the price to revert.
⚙️ Strategy Concept
The RSI measures market momentum on a scale of 0–100.
When RSI is too low, it signals an oversold market → potential buy.
When RSI is too high, it signals an overbought market → potential sell.
This strategy sets two reversal zones using dual RSI bands:
Zone RSI Range Meaning Action
Upper Band 80–90 Overbought Prepare to Sell
Lower Band 10–20 Oversold Prepare to Buy
🧩 Code Breakdown
1. Input Parameters
rsiLength = input.int(14)
upperBandHigh = input.float(90.0)
upperBandLow = input.float(80.0)
lowerBandLow = input.float(10.0)
lowerBandHigh = input.float(20.0)
You can adjust:
RSI Length (default 14) → sensitivity of the RSI.
Upper/Lower Bands → control when buy/sell triggers occur.
2. RSI Calculation
rsi = ta.rsi(close, rsiLength)
Calculates the RSI of the closing price over 14 periods.
3. Signal Logic
buySignal = ta.crossover(rsi, lowerBandHigh)
sellSignal = ta.crossunder(rsi, upperBandLow)
Buy Signal: RSI crosses up through 20 → market rebounding from oversold.
Sell Signal: RSI crosses down through 80 → market turning from overbought.
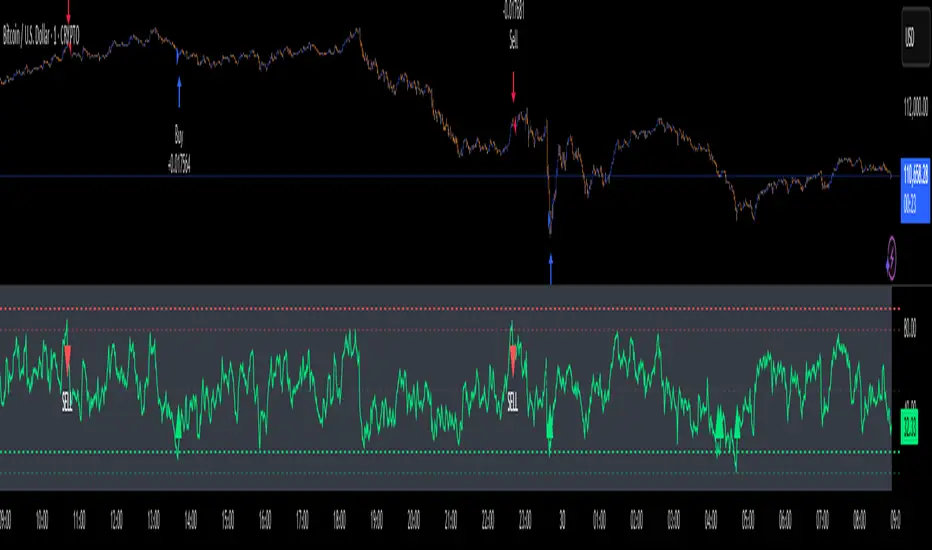
4. Plotting
RSI line (lime green)
Bands:
🔴 80–90 (Sell Zone)
🟢 10–20 (Buy Zone)
Gray midline at 50 for reference.
Triangle markers for signals:
🟢 “BUY” below chart
🔴 “SELL” above chart
5. Trading Logic
if (buySignal)
strategy.entry("Buy", strategy.long)
if (sellSignal)
strategy.entry("Sell", BTCUSD strategy.short
  XAUUSD )
Opens a long position on a buy signal.
Opens a short position on a sell signal.
No explicit stop loss or take profit — positions reverse when an opposite signal appears.
🧠 How It Works (Step-by-Step Example)
RSI drops below 20 → oversold → buy signal triggers.
RSI rises toward 80 → overbought → sell signal triggers.
Strategy flips position, always staying in the market (either long or short).
📈 Visual Summary
Imagine the RSI line oscillating between 0 and 100:
100 ────────────────────────────────
90 ───── Upper Band High (Sell Limit)
80 ───── Upper Band Low (Sell Trigger)
50 ───── Midline
20 ───── Lower Band High (Buy Trigger)
10 ───── Lower Band Low (Buy Limit)
0 ────────────────────────────────
When RSI moves above 80 → SELL
When RSI moves below 20 → BUY
⚡ Strategy Profile
Category Description
Type Mean Reversion
Entry Rule RSI crosses up 20 → Buy
Exit/Reverse Rule RSI crosses down 80 → Sell
Strengths Simple, effective in sideways/range markets, minimal lag
Weaknesses Weak in strong trends, no stop-loss or take-profit logic
💡 Suggested Improvements
You can enhance this script by adding:
Stop loss & take profit levels (e.g., % or ATR-based).
Trend filter (e.g., trade only in direction of 200 EMA).
RSI smoothing to reduce noise.
It identifies potential trend reversals when price momentum reaches extreme overbought or oversold levels — then enters trades expecting the price to revert.
⚙️ Strategy Concept
The RSI measures market momentum on a scale of 0–100.
When RSI is too low, it signals an oversold market → potential buy.
When RSI is too high, it signals an overbought market → potential sell.
This strategy sets two reversal zones using dual RSI bands:
Zone RSI Range Meaning Action
Upper Band 80–90 Overbought Prepare to Sell
Lower Band 10–20 Oversold Prepare to Buy
🧩 Code Breakdown
1. Input Parameters
rsiLength = input.int(14)
upperBandHigh = input.float(90.0)
upperBandLow = input.float(80.0)
lowerBandLow = input.float(10.0)
lowerBandHigh = input.float(20.0)
You can adjust:
RSI Length (default 14) → sensitivity of the RSI.
Upper/Lower Bands → control when buy/sell triggers occur.
2. RSI Calculation
rsi = ta.rsi(close, rsiLength)
Calculates the RSI of the closing price over 14 periods.
3. Signal Logic
buySignal = ta.crossover(rsi, lowerBandHigh)
sellSignal = ta.crossunder(rsi, upperBandLow)
Buy Signal: RSI crosses up through 20 → market rebounding from oversold.
Sell Signal: RSI crosses down through 80 → market turning from overbought.
4. Plotting
RSI line (lime green)
Bands:
🔴 80–90 (Sell Zone)
🟢 10–20 (Buy Zone)
Gray midline at 50 for reference.
Triangle markers for signals:
🟢 “BUY” below chart
🔴 “SELL” above chart
5. Trading Logic
if (buySignal)
strategy.entry("Buy", strategy.long)
if (sellSignal)
strategy.entry("Sell",
Opens a long position on a buy signal.
Opens a short position on a sell signal.
No explicit stop loss or take profit — positions reverse when an opposite signal appears.
🧠 How It Works (Step-by-Step Example)
RSI drops below 20 → oversold → buy signal triggers.
RSI rises toward 80 → overbought → sell signal triggers.
Strategy flips position, always staying in the market (either long or short).
📈 Visual Summary
Imagine the RSI line oscillating between 0 and 100:
100 ────────────────────────────────
90 ───── Upper Band High (Sell Limit)
80 ───── Upper Band Low (Sell Trigger)
50 ───── Midline
20 ───── Lower Band High (Buy Trigger)
10 ───── Lower Band Low (Buy Limit)
0 ────────────────────────────────
When RSI moves above 80 → SELL
When RSI moves below 20 → BUY
⚡ Strategy Profile
Category Description
Type Mean Reversion
Entry Rule RSI crosses up 20 → Buy
Exit/Reverse Rule RSI crosses down 80 → Sell
Strengths Simple, effective in sideways/range markets, minimal lag
Weaknesses Weak in strong trends, no stop-loss or take-profit logic
💡 Suggested Improvements
You can enhance this script by adding:
Stop loss & take profit levels (e.g., % or ATR-based).
Trend filter (e.g., trade only in direction of 200 EMA).
RSI smoothing to reduce noise.
Script open-source
In pieno spirito TradingView, il creatore di questo script lo ha reso open-source, in modo che i trader possano esaminarlo e verificarne la funzionalità. Complimenti all'autore! Sebbene sia possibile utilizzarlo gratuitamente, ricorda che la ripubblicazione del codice è soggetta al nostro Regolamento.
Declinazione di responsabilità
Le informazioni ed i contenuti pubblicati non costituiscono in alcun modo una sollecitazione ad investire o ad operare nei mercati finanziari. Non sono inoltre fornite o supportate da TradingView. Maggiori dettagli nelle Condizioni d'uso.