PROTECTED SOURCE SCRIPT
RSI Overbought/Oversold Overlay
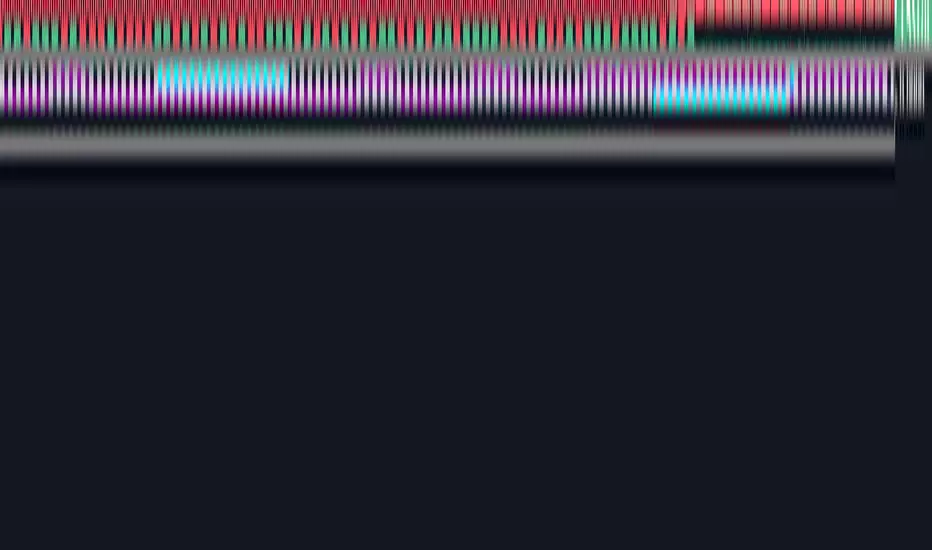
Do you love RSI Overbought/Oversold signals, but want more space on the screen for the actual price chart? "RSI Overbought/Oversold Overlay" to the rescue! This indicator highlights the chart's background color green when the RSI goes overbought and red when the RSI goes oversold. You can set the RSI length, overbought level, and oversold level in the format box.
Obviously, this is not the indicator to use if you're looking for things like RSI divergence, but if you're only interested in when RSI reaches the extremes of the range, this can save you some screen real estate.
Obviously, this is not the indicator to use if you're looking for things like RSI divergence, but if you're only interested in when RSI reaches the extremes of the range, this can save you some screen real estate.
Script protetto
Questo script è pubblicato come codice protetto. Tuttavia, è possibile utilizzarle liberamente e senza alcuna limitazione – ulteriori informazioni qui.
Declinazione di responsabilità
Le informazioni e le pubblicazioni non sono intese come, e non costituiscono, consulenza o raccomandazioni finanziarie, di investimento, di trading o di altro tipo fornite o approvate da TradingView. Per ulteriori informazioni, consultare i Termini di utilizzo.