OPEN-SOURCE SCRIPT
Study: Candle MA Distance (ATR)
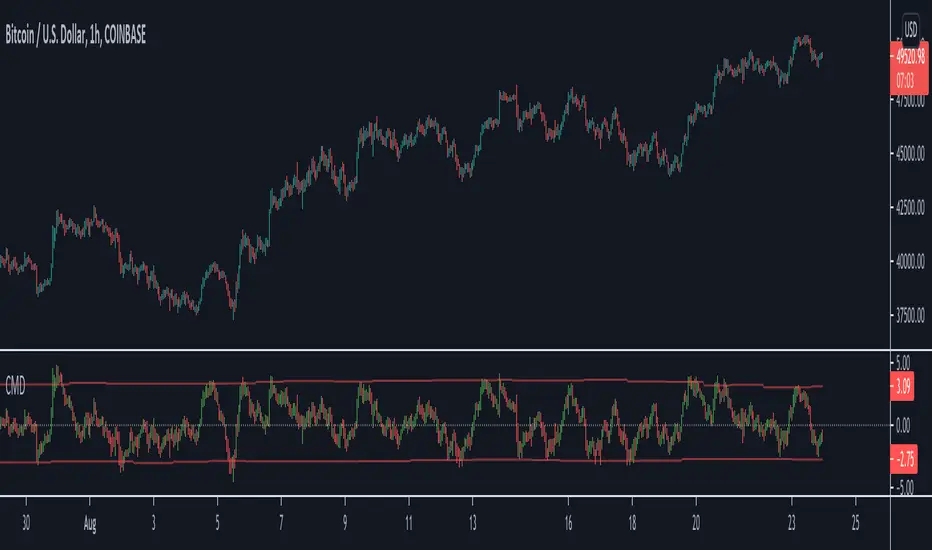
Simple script that plots price to MA distance (ATR) as a bar chart.
ATR is being used here instead of % because ATR keeps it relative to current volatility (1ATR move in either direction can have very different % for when price at 20cent and 2 dollars).
Upper/Lower band is calculated based on the average of previous peak/trough. Price approaching the band could signal overextended in the short term movement, expect price to consolidate/retrace to the MA.
Caution: if the indicator shows the price "pulled back" to MA, the actual price could still go up (or down), just a little slower then the MA
Adjustable Settings:
- Plot as bar or line
- MA Type and Length
- ATR Length
█ Disclaimer
Past performance is not an indicator of future results.
My opinions and research are my own and do not constitute financial advice in any way whatsoever.
Nothing published by me constitutes an investment recommendation, nor should any data or Content published by me be relied upon for any investment/trading activities.
I strongly recommends that you perform your own independent research and/or speak with a qualified investment professional before making any financial decisions.
Script open-source
Nello spirito di TradingView, l'autore di questo script lo ha reso open source, in modo che i trader possano esaminarne e verificarne la funzionalità. Complimenti all'autore! Sebbene sia possibile utilizzarlo gratuitamente, ricordiamo che la ripubblicazione del codice è soggetta al nostro Regolamento.
Declinazione di responsabilità
Le informazioni e le pubblicazioni non sono intese come, e non costituiscono, consulenza o raccomandazioni finanziarie, di investimento, di trading o di altro tipo fornite o approvate da TradingView. Per ulteriori informazioni, consultare i Termini di utilizzo.