OPEN-SOURCE SCRIPT
Previous 4-Hour High/Low
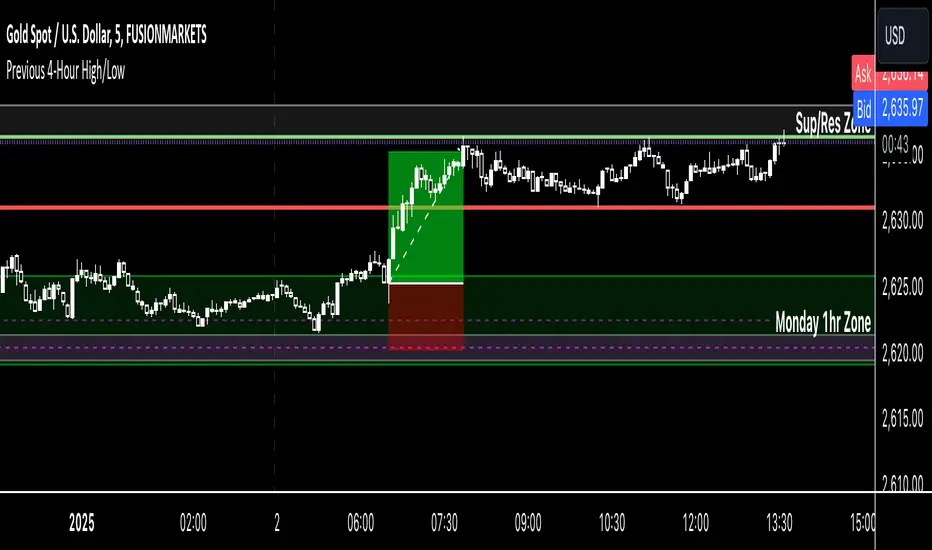
Indicator Name: Previous 4-Hour High/Low Lines
Description:
This indicator highlights the high and low levels of the previous candle from a user-defined timeframe (default: 4 hours) and extends these levels both to the left and right across the chart. It allows traders to visualize key support and resistance levels from higher timeframes while analyzing lower timeframe charts.
Key Features:
• Customizable Timeframe: Select any timeframe (e.g., 4-hour, daily) to track the high and low of the previous candle.
• Dynamic Updates: The high and low levels update automatically with each new candle.
• Extended Levels: Lines extend both left and right, providing a clear reference for past and future price action.
• Overlay on Chart: The indicator works seamlessly on any timeframe, making it ideal for multi-timeframe analysis.
Use Case:
This tool is perfect for traders who rely on higher timeframe levels for setting entry/exit points, identifying potential breakout zones, or managing risk. By visualizing these levels directly on lower timeframe charts, traders can make informed decisions without switching between charts.
Script open-source
Nello spirito di TradingView, l'autore di questo script lo ha reso open source, in modo che i trader possano esaminarne e verificarne la funzionalità. Complimenti all'autore! Sebbene sia possibile utilizzarlo gratuitamente, ricordiamo che la ripubblicazione del codice è soggetta al nostro Regolamento.
Declinazione di responsabilità
Le informazioni e le pubblicazioni non sono intese come, e non costituiscono, consulenza o raccomandazioni finanziarie, di investimento, di trading o di altro tipo fornite o approvate da TradingView. Per ulteriori informazioni, consultare i Termini di utilizzo.