OPEN-SOURCE SCRIPT
Aggiornato SMA 119
Sometimes simplicity is a key.
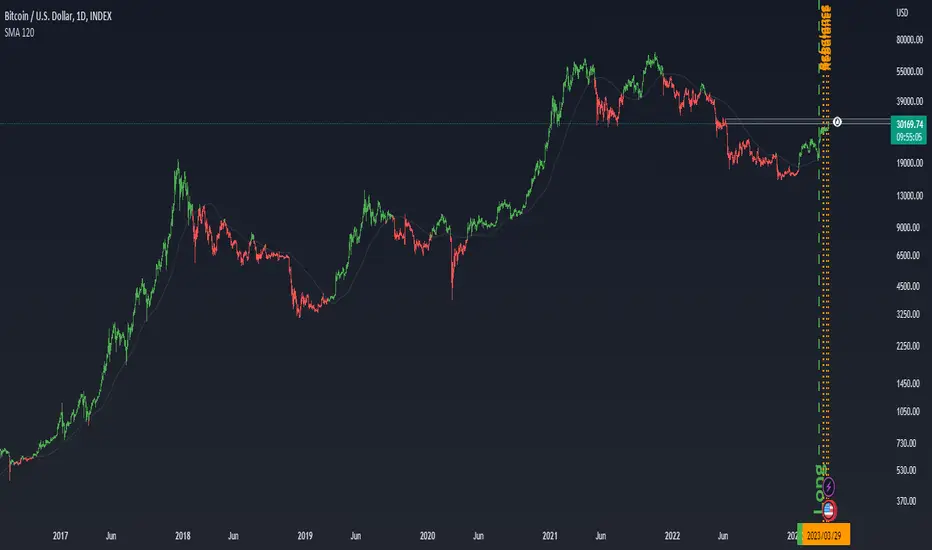
This is a Simple Moving Average of 119 period on daily timeframe.
When hl2 of price is above SMA it plot green candles (up trend), when below it plot red candles (down trend)
So it shows you a long term direction of BTC
It is very useful indicator to see in what stage BTC is now, Bear or Bull. Yes it seems to be very simple, but it works.
Sometimes to dig a hole, you dont need an excavator you just need an shovel. In this case shovel is a SMA =)
BackTest of indicator
https://www.tradingview.com/x/boR3okbF
Note di rilascio
-Script open-source
Nello spirito di TradingView, l'autore di questo script lo ha reso open source, in modo che i trader possano esaminarne e verificarne la funzionalità. Complimenti all'autore! Sebbene sia possibile utilizzarlo gratuitamente, ricordiamo che la ripubblicazione del codice è soggetta al nostro Regolamento.
Declinazione di responsabilità
Le informazioni e le pubblicazioni non sono intese come, e non costituiscono, consulenza o raccomandazioni finanziarie, di investimento, di trading o di altro tipo fornite o approvate da TradingView. Per ulteriori informazioni, consultare i Termini di utilizzo.
Script open-source
Nello spirito di TradingView, l'autore di questo script lo ha reso open source, in modo che i trader possano esaminarne e verificarne la funzionalità. Complimenti all'autore! Sebbene sia possibile utilizzarlo gratuitamente, ricordiamo che la ripubblicazione del codice è soggetta al nostro Regolamento.
Declinazione di responsabilità
Le informazioni e le pubblicazioni non sono intese come, e non costituiscono, consulenza o raccomandazioni finanziarie, di investimento, di trading o di altro tipo fornite o approvate da TradingView. Per ulteriori informazioni, consultare i Termini di utilizzo.