OPEN-SOURCE SCRIPT
Bullish Gap Up Detection
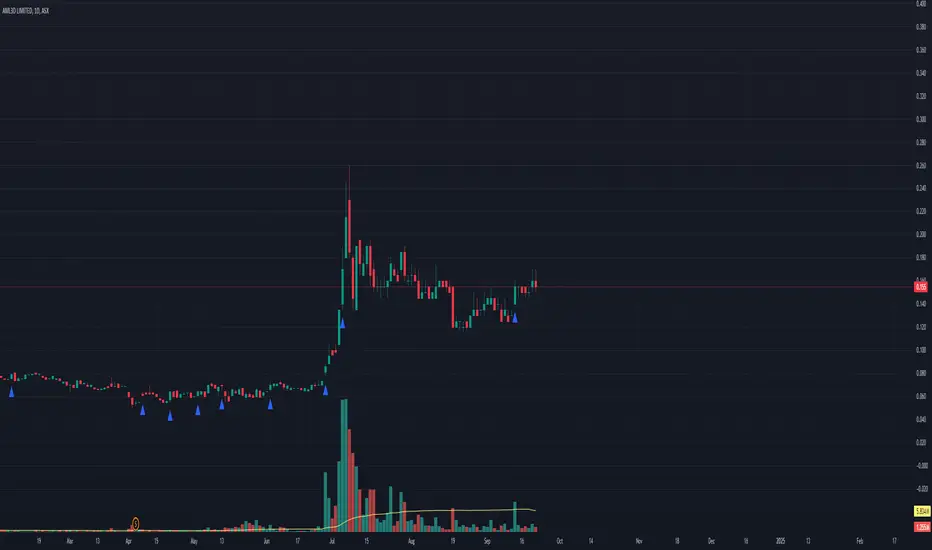
This indicator is designed to identify gap-up trading opportunities in real-time. A gap-up occurs when the opening price of a stock is higher than the previous day's high, signaling potential bullish momentum.
Key Features:
Gap Detection: The indicator detects when today’s open is above yesterday’s high and remains above that level throughout the trading session.
Visual Alerts: A triangle shape appears below the price bar when a gap-up condition is met, providing clear visual signals for traders to consider potential entry points.
EMA Analysis: The indicator incorporates two Exponential Moving Averages:
10-day EMA: Used to assess short-term price trends and help determine if the stock is currently in an upward momentum phase.
20-day EMA: Provides additional context for medium-term trends, ensuring that gaps are only considered when the stock is in a favorable trend.
The indicator confirms that the 10-day EMA is above the 20-day EMA, indicating bullish sentiment in the market.
This indicator can be used in various trading strategies to capitalize on momentum following gap-up openings. It’s suitable for day traders and swing traders looking for entry points in trending stocks.
Script open-source
Nello spirito di TradingView, l'autore di questo script lo ha reso open source, in modo che i trader possano esaminarne e verificarne la funzionalità. Complimenti all'autore! Sebbene sia possibile utilizzarlo gratuitamente, ricordiamo che la ripubblicazione del codice è soggetta al nostro Regolamento.
Declinazione di responsabilità
Le informazioni e le pubblicazioni non sono intese come, e non costituiscono, consulenza o raccomandazioni finanziarie, di investimento, di trading o di altro tipo fornite o approvate da TradingView. Per ulteriori informazioni, consultare i Termini di utilizzo.