OPEN-SOURCE SCRIPT
Aggiornato COT Index by Niels
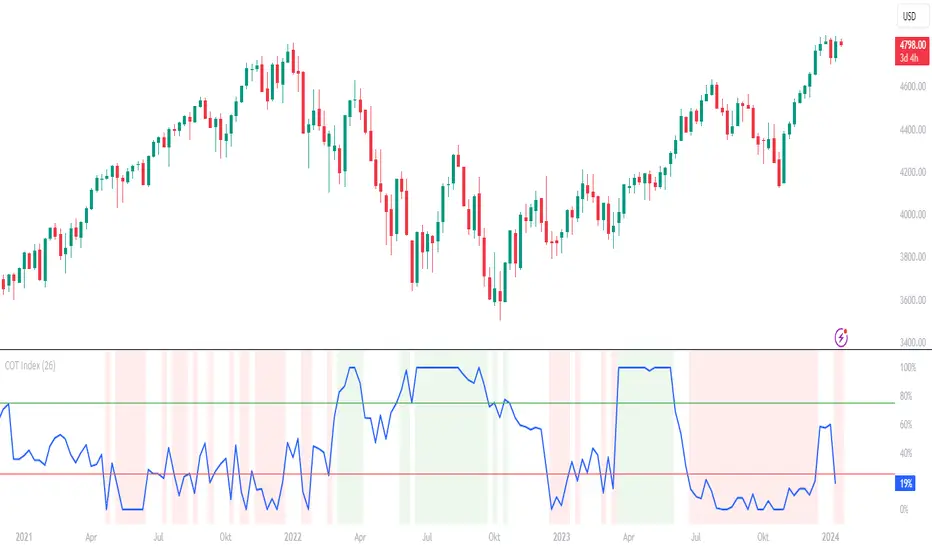
The COT index is an indicator for determining trend reversals based on the net positions of commercials from the CFTC COT report.
A time frame of 26 weeks is selected as the basis. If the value is greater than or equal to 75, this is a bullish sign; if it is less than or equal to 25, this is a bearish sign.
You can select the number of weeks to be used for the calculation.
As the CFTC data is only published on Fridays at 21:30, the value of the current week is hidden until the market closes.
In addition, the background changes color when the index reaches an extreme range.
Both functions can be deactivated in the settings.
Note di rilascio
Added correction for the copper futures to show the correct value.Note di rilascio
Two functions have been added:1. A COT proxy function has been added, which calculates COT data using the price range without the CFTC report. This is enabled by default for the DAX future and can be applied to all other futures through the options if needed. The formula was developed by Larry Williams.
2. It is now also possible to view the change of the COT index compared to the previous week. This can also be activated in the options.
Note di rilascio
Added "Hide Until New Data" (default enabled):The COT Index is now only displayed if the data for the current week differs from the previous week. Prevents showing unchanged or outdated data.
Script open-source
Nello spirito di TradingView, l'autore di questo script lo ha reso open source, in modo che i trader possano esaminarne e verificarne la funzionalità. Complimenti all'autore! Sebbene sia possibile utilizzarlo gratuitamente, ricordiamo che la ripubblicazione del codice è soggetta al nostro Regolamento.
Declinazione di responsabilità
Le informazioni e le pubblicazioni non sono intese come, e non costituiscono, consulenza o raccomandazioni finanziarie, di investimento, di trading o di altro tipo fornite o approvate da TradingView. Per ulteriori informazioni, consultare i Termini di utilizzo.