OPEN-SOURCE SCRIPT
Sniper Stochastics 2
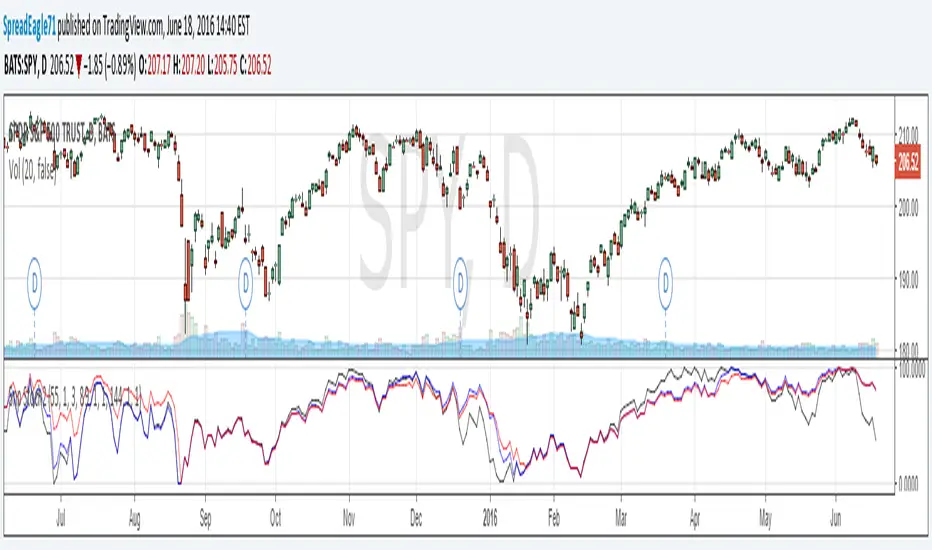
Sniper Stochastics 2 is like the other one - a triple stochastics consisting of different lengths, in this case 55,89,144.
One thing I noticed was that the stochastics lines can be a kind of divergence detector with the slow (red), medium (blue) and fast(black) lines making breakaways once they converge.
For example, if the lines are together and the black line starts to diverge upwards, it means that there is a positive divergence which will happen quickly and then end. The blue and the red lines are longer term divergences.
I wanted to share this one and the unique and interesting use of divergences with this indicator.
Script open-source
In pieno spirito TradingView, il creatore di questo script lo ha reso open-source, in modo che i trader possano esaminarlo e verificarne la funzionalità. Complimenti all'autore! Sebbene sia possibile utilizzarlo gratuitamente, ricorda che la ripubblicazione del codice è soggetta al nostro Regolamento.
Declinazione di responsabilità
Le informazioni ed i contenuti pubblicati non costituiscono in alcun modo una sollecitazione ad investire o ad operare nei mercati finanziari. Non sono inoltre fornite o supportate da TradingView. Maggiori dettagli nelle Condizioni d'uso.