Selezione editorialeOPEN-SOURCE SCRIPT
VolumeHeatmap | Experimental Version of Marketorders Matrix
Dear all,
I wish a Happy New Year!
The last time I tried to developing a Volume Heatmap, that the Marketorders made.
With the currently version I achieve my skills for that and I present it for everyone - some bugs I cannot solve today.
It also possible to see the POC - also the dynamic of volume developing:


The background for that is to find the pricelevel with the most volume - this is for valuetrading always the target.
If someone find it useful or have question - let me know!
Kind regards
NXT2017
I wish a Happy New Year!
The last time I tried to developing a Volume Heatmap, that the Marketorders made.
With the currently version I achieve my skills for that and I present it for everyone - some bugs I cannot solve today.
It also possible to see the POC - also the dynamic of volume developing:
The background for that is to find the pricelevel with the most volume - this is for valuetrading always the target.
If someone find it useful or have question - let me know!
Kind regards
NXT2017
Note di rilascio
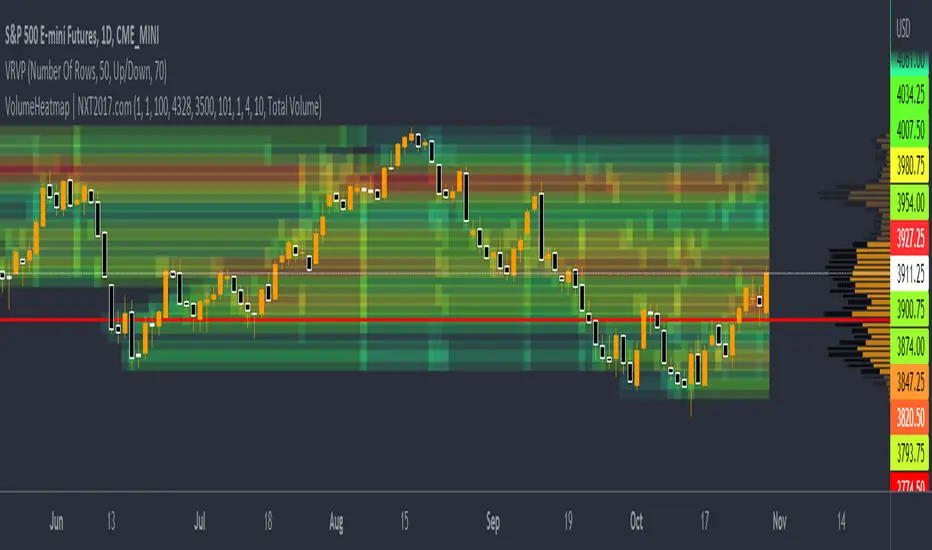
Update of the Heatmap- Change the color printing to thermal falsecolor (high volume are red and low volume are blue/green and the transparency goes from 50% to 100% to avoid overlapping the candles)
- Remove automatic length and High/Low (it's really necessary to choose manuelle high and low price)
- Now you can manage the visible of boxes
How it works:
This indicator plots the maximum allowed lines of 31 that an indicator on TradingView has. For more lines, you need to copy the indicator to the same chart and change the box ID.
This script calculates the volume for every price of past candles that you have to choose on "count bars back". Then the sum of every price is divided through the maximum volume a price level has in this range that was cumulated on the last bars.
How it helps
If you ask how you can use it - I really testing it at now... but I have found is fantastic. You can find the pricelevel that are really nice resistance / support levels. Look here on this examples:
Note di rilascio
*some bugs solvedScript open-source
Nello spirito di TradingView, l'autore di questo script lo ha reso open source, in modo che i trader possano esaminarne e verificarne la funzionalità. Complimenti all'autore! Sebbene sia possibile utilizzarlo gratuitamente, ricordiamo che la ripubblicazione del codice è soggetta al nostro Regolamento.
🐺 Wolfe Wave AutoPattern: nxt2017.com/ww
🎯 Elliott Wave Auto Counting: nxt2017.com/ew
💥 Impulse Scalper: nxt2017.com/im
📈 Cheapest Entry: nxt2017.com/pi
Discount Coupon:
nxtcoupon20 for -20%
🎯 Elliott Wave Auto Counting: nxt2017.com/ew
💥 Impulse Scalper: nxt2017.com/im
📈 Cheapest Entry: nxt2017.com/pi
Discount Coupon:
nxtcoupon20 for -20%
Declinazione di responsabilità
Le informazioni e le pubblicazioni non sono intese come, e non costituiscono, consulenza o raccomandazioni finanziarie, di investimento, di trading o di altro tipo fornite o approvate da TradingView. Per ulteriori informazioni, consultare i Termini di utilizzo.
Script open-source
Nello spirito di TradingView, l'autore di questo script lo ha reso open source, in modo che i trader possano esaminarne e verificarne la funzionalità. Complimenti all'autore! Sebbene sia possibile utilizzarlo gratuitamente, ricordiamo che la ripubblicazione del codice è soggetta al nostro Regolamento.
🐺 Wolfe Wave AutoPattern: nxt2017.com/ww
🎯 Elliott Wave Auto Counting: nxt2017.com/ew
💥 Impulse Scalper: nxt2017.com/im
📈 Cheapest Entry: nxt2017.com/pi
Discount Coupon:
nxtcoupon20 for -20%
🎯 Elliott Wave Auto Counting: nxt2017.com/ew
💥 Impulse Scalper: nxt2017.com/im
📈 Cheapest Entry: nxt2017.com/pi
Discount Coupon:
nxtcoupon20 for -20%
Declinazione di responsabilità
Le informazioni e le pubblicazioni non sono intese come, e non costituiscono, consulenza o raccomandazioni finanziarie, di investimento, di trading o di altro tipo fornite o approvate da TradingView. Per ulteriori informazioni, consultare i Termini di utilizzo.