OPEN-SOURCE SCRIPT
SDSpike
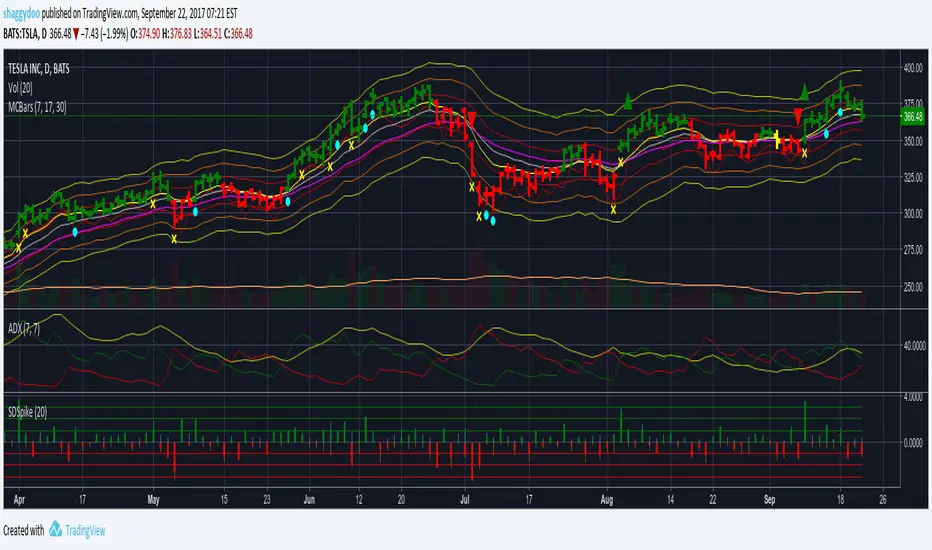
Price Change as Standard Deviation Spikes
Plots price changes scaled to daily StdDev for the period
The Close price change is plotted as a thick bar coloured green for up close, red for down close
The High price change is plotted as a thin bar coloured aqua
The Low price change is plotted as a thin bar coloured orange
Can be used to understand the statistical price behaviour of the symbol.
Very useful for earnings trades and in general for options trades.
Script open-source
Nello spirito di TradingView, l'autore di questo script lo ha reso open source, in modo che i trader possano esaminarne e verificarne la funzionalità. Complimenti all'autore! Sebbene sia possibile utilizzarlo gratuitamente, ricordiamo che la ripubblicazione del codice è soggetta al nostro Regolamento.
Declinazione di responsabilità
Le informazioni e le pubblicazioni non sono intese come, e non costituiscono, consulenza o raccomandazioni finanziarie, di investimento, di trading o di altro tipo fornite o approvate da TradingView. Per ulteriori informazioni, consultare i Termini di utilizzo.