PROTECTED SOURCE SCRIPT
Traders AID / Adaptive Smoothing Line (use on 1-week TF)
TradersAID – Adaptive Smoothing Line (use on 1-week TF)
1. Overview
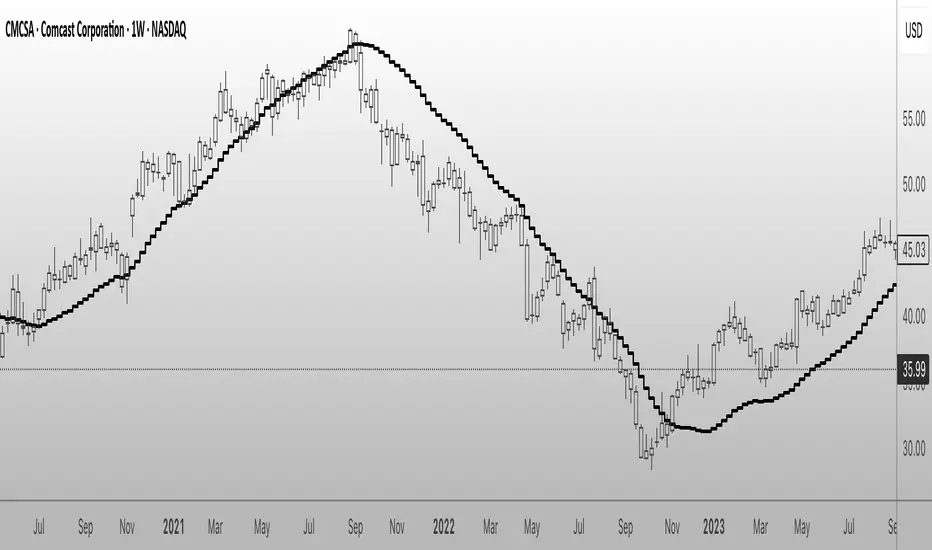
TradersAID – Adaptive Smoothing Line is a trend-following overlay designed to bring structure to noisy markets — especially on the 1-week chart, where clarity is crucial.
Instead of using conventional moving averages, this tool applies a Kalman-inspired smoothing method that adapts to changing price behavior.
Originally used in fields like robotics and autonomous driving, this filtering concept helps track directional flow without overreacting to minor fluctuations — making it easier to identify sustained moves or exhaustion patterns.
2. What It Does
The line continuously adapts to current market conditions by filtering volatility and directional flow through an internal estimator logic.
Unlike laggy moving averages, it does not simply average past prices — it adjusts dynamically based on how price behaves.
Key behaviors include:
• Directional slope that reflects trend strength
• Increased sensitivity during acceleration phases
• Stabilized flattening during sideways periods
This makes the trend easier to follow without being distracted by short-term chop.
3. How to Use It
• Trend Interpretation:
Use the line’s angle to judge momentum. Steep slopes show conviction, while flattening may signal transition or fading strength.
• Support & Resistance Context:
During trending phases, the line often acts as dynamic support or resistance — especially when combined with other tools.
• Volatility Filtering:
In consolidation, the line becomes smoother, helping reduce noise and simplify your view of structure.
• Layering Tool:
Use it as a visual foundation beneath more reactive tools like TradersAID Warning Dots or Velocity Coloring to stay grounded in context.
4. Key Features
• Adaptive Behavior: Responds to both price and volatility
• Three Modes:
o Slow for structure clarity
o Regular for balanced responsiveness
o Fast for shorter-term context
• Overlay Design: Plots directly on price for seamless interpretation
• Minimalist Output: Clean, unobtrusive line — no clutter
5. Technical Basis (Why It’s Closed Source)
This tool uses a custom smoothing technique based on Kalman-inspired logic, tuned specifically for longer-term trend structure.
While not a full Kalman implementation, the core idea is drawn from systems that track state under uncertainty — offering stability without lagging behind price.
The algorithm adapts continuously to live market input, producing a smooth yet responsive curve that reflects trend direction and change in a visually intuitive way.
As this smoothing mechanism is not available in open-source scripts and is part of a broader proprietary system, the code remains closed to protect its originality and performance edge.
6. Settings
• Mode Selection: Fast / Regular / Slow
• Styling Controls: Color, line width, smoothing curve
• Frame Lock:
✅ This tool is designed to work exclusively on the 1-week timeframe.
7. Disclaimer
This script is for educational and informational purposes only. It does not provide financial advice or generate trading signals. Use with your own judgment and supporting tools.
1. Overview
TradersAID – Adaptive Smoothing Line is a trend-following overlay designed to bring structure to noisy markets — especially on the 1-week chart, where clarity is crucial.
Instead of using conventional moving averages, this tool applies a Kalman-inspired smoothing method that adapts to changing price behavior.
Originally used in fields like robotics and autonomous driving, this filtering concept helps track directional flow without overreacting to minor fluctuations — making it easier to identify sustained moves or exhaustion patterns.
2. What It Does
The line continuously adapts to current market conditions by filtering volatility and directional flow through an internal estimator logic.
Unlike laggy moving averages, it does not simply average past prices — it adjusts dynamically based on how price behaves.
Key behaviors include:
• Directional slope that reflects trend strength
• Increased sensitivity during acceleration phases
• Stabilized flattening during sideways periods
This makes the trend easier to follow without being distracted by short-term chop.
3. How to Use It
• Trend Interpretation:
Use the line’s angle to judge momentum. Steep slopes show conviction, while flattening may signal transition or fading strength.
• Support & Resistance Context:
During trending phases, the line often acts as dynamic support or resistance — especially when combined with other tools.
• Volatility Filtering:
In consolidation, the line becomes smoother, helping reduce noise and simplify your view of structure.
• Layering Tool:
Use it as a visual foundation beneath more reactive tools like TradersAID Warning Dots or Velocity Coloring to stay grounded in context.
4. Key Features
• Adaptive Behavior: Responds to both price and volatility
• Three Modes:
o Slow for structure clarity
o Regular for balanced responsiveness
o Fast for shorter-term context
• Overlay Design: Plots directly on price for seamless interpretation
• Minimalist Output: Clean, unobtrusive line — no clutter
5. Technical Basis (Why It’s Closed Source)
This tool uses a custom smoothing technique based on Kalman-inspired logic, tuned specifically for longer-term trend structure.
While not a full Kalman implementation, the core idea is drawn from systems that track state under uncertainty — offering stability without lagging behind price.
The algorithm adapts continuously to live market input, producing a smooth yet responsive curve that reflects trend direction and change in a visually intuitive way.
As this smoothing mechanism is not available in open-source scripts and is part of a broader proprietary system, the code remains closed to protect its originality and performance edge.
6. Settings
• Mode Selection: Fast / Regular / Slow
• Styling Controls: Color, line width, smoothing curve
• Frame Lock:
✅ This tool is designed to work exclusively on the 1-week timeframe.
7. Disclaimer
This script is for educational and informational purposes only. It does not provide financial advice or generate trading signals. Use with your own judgment and supporting tools.
Script protetto
Questo script è pubblicato come codice protetto. Tuttavia, è possibile utilizzarle liberamente e senza alcuna limitazione – ulteriori informazioni qui.
Declinazione di responsabilità
Le informazioni e le pubblicazioni non sono intese come, e non costituiscono, consulenza o raccomandazioni finanziarie, di investimento, di trading o di altro tipo fornite o approvate da TradingView. Per ulteriori informazioni, consultare i Termini di utilizzo.