OPEN-SOURCE SCRIPT
[blackcat] L3 Trend Box
OVERVIEW
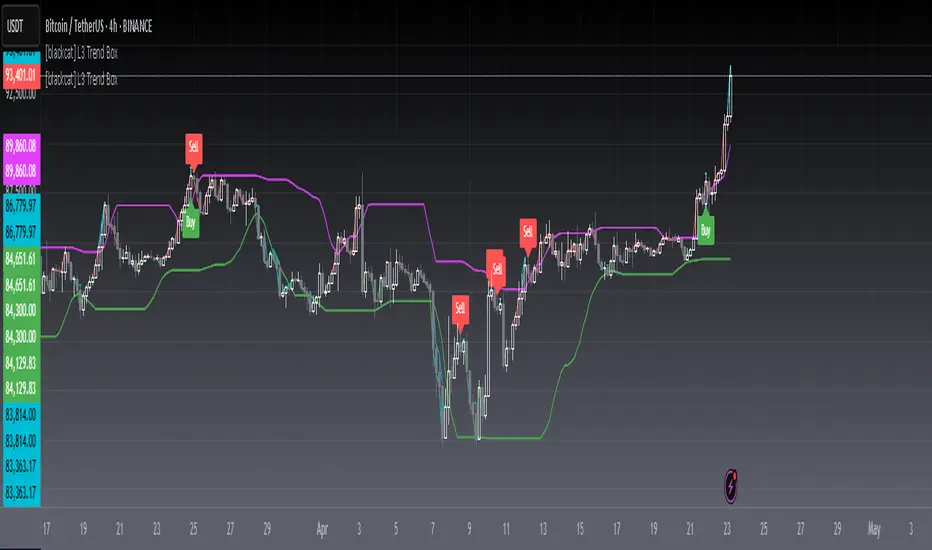
The [blackcat] L3 Trend Box indicator is a sophisticated technical analysis tool designed to assist traders in identifying trends and pinpointing potential entry and exit points within the market. By leveraging multiple moving averages and price level analyses, this indicator provides a detailed view of market dynamics. It plots several key lines and labels directly onto the chart, offering clear visual signals for both bullish and bearish scenarios. Its adaptability through customizable parameters makes it suitable for various trading strategies and market conditions 📊✅.
FEATURES
Comprehensive Parameter Customization: Tailor the indicator to match specific trading preferences:
High Length: Defines the period over which the highest prices are considered.
Low Length: Specifies the period for evaluating the lowest prices.
Upper Box Length: Smoothes out the upper boundary of the trend box using a specified period.
Lower Box Length: Smoothes out the lower boundary of the trend box similarly.
Trend Line Length: Determines the period for calculating the overall trend line.
Fast EMA Length: Sets the period for the fast-moving exponential moving average (EMA), crucial for capturing short-term movements.
MA15 EMA Length: Configures the period for the medium-term moving average (MA15 EMA) to provide a balanced perspective.
Short Spirit Length: Influences how quickly the indicator responds to recent price changes.
Golden EMA Length: Fine-tunes the long-term EMA for stability and reliability.
Buy Price Length: Establishes the lookback period for determining optimal buy prices.
Var1 Length & Var2 Length: Adjusts periods for variance calculations, enhancing the accuracy of trend detection.
Detailed Chart Plots:
Upper Box Top: A fuchsia-colored line representing the smoothed highest prices, marking resistance levels.
Lower Box Bottom: A green-colored line showing the smoothed lowest prices, highlighting support zones.
MA15 Up/Down: Dynamic red and green lines illustrating the directionality of the 15-period EMA, helping gauge momentum shifts.
Conditional Plots: Multiple lines based on intricate price actions and computed values, such as closing below the lower box while also closing at or above/below the opening price, ensuring nuanced insights into market behavior.
Buy/Sell Labels: Clearly marked 'Buy' and 'Sell' labels positioned strategically on the chart, facilitating quick decision-making without missing critical signals 🎯.
Alert System: Automatically generates alerts based on predefined buy and sell conditions, enabling timely responses to market changes 🛎️.
HOW TO USE
Adding the Indicator: Start by adding the [blackcat] L3 Trend Box to your TradingView chart via the indicators menu.
Parameter Configuration: Adjust each parameter according to your trading style and market volatility. For instance, increasing the High Length can make the indicator less sensitive to minor fluctuations but more responsive to significant trends.
Monitoring Signals: Keep an eye on the plotted lines and labels. Pay special attention to the crossover events between the fast EMA and the lower box bottom, as these often signify strong buy signals.
Setting Alerts: Configure alerts based on the buy/sell conditions provided by the indicator. This ensures you never miss an opportunity due to inattention.
Combining Strategies: While powerful on its own, combining this indicator with others like RSI or Bollinger Bands can enhance its predictive power and reduce false positives.
LIMITATIONS
Market Volatility: In extremely volatile or sideways-trending markets, the indicator might produce false signals. Always verify with additional confirmations.
Asset-Specific Performance: Different assets and timeframes will yield varying results; thorough backtesting across diverse instruments is recommended.
Over-Reliance Risk: Avoid relying solely on this indicator. Integrate it into a broader analytical framework that includes fundamental analysis and other technical indicators.
NOTES
Data Sufficiency: Ensure ample historical data is available for precise computations. Lack of data can skew results and lead to inaccurate signals.
Demo Testing: Before deploying the indicator in real trades, rigorously test it on demo accounts under varied market conditions to understand its strengths and weaknesses.
Customization Flexibility: Feel free to tweak the parameters continuously until they align perfectly with your unique trading approach and risk tolerance.
Script open-source
Nello spirito di TradingView, l'autore di questo script lo ha reso open source, in modo che i trader possano esaminarne e verificarne la funzionalità. Complimenti all'autore! Sebbene sia possibile utilizzarlo gratuitamente, ricordiamo che la ripubblicazione del codice è soggetta al nostro Regolamento.
Avoid losing contact!Don't miss out! The first and most important thing to do is to join my Discord chat now! Click here to start your adventure: discord.com/invite/ZTGpQJq 防止失联,请立即行动,加入本猫聊天群: discord.com/invite/ZTGpQJq
Declinazione di responsabilità
Le informazioni e le pubblicazioni non sono intese come, e non costituiscono, consulenza o raccomandazioni finanziarie, di investimento, di trading o di altro tipo fornite o approvate da TradingView. Per ulteriori informazioni, consultare i Termini di utilizzo.