Swing elite Trend direction
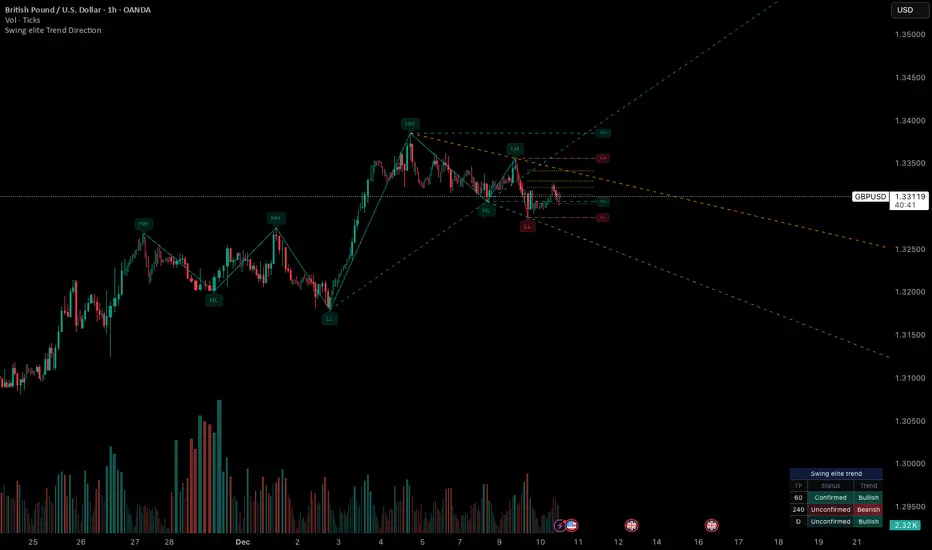
A comprehensive market structure indicator that identifies swing highs/lows, labels them with HH/HL/LH/LL structure, draws dynamic trendlines, and provides multi-timeframe trend analysis.
🔹 FEATURES
Market Structure Analysis
Automatically detects swing highs and swing lows
Labels each pivot with its structure type: HH (Higher High), HL (Higher Low), LH (Lower High), LL (Lower Low)
Color-coded zigzag lines based on confirmed trend direction
Structure Trendlines
Downtrend Line: Connects HH to LH (resistance in bearish structure)
Uptrend Line: Connects LL to HL (support in bullish structure)
Extended projection for potential future price interaction
Swing Trendlines
Connects the last 2 swing highs (resistance trendline)
Connects the last 2 swing lows (support trendline)
Optional extension to project future levels
Break Levels
Horizontal lines at key structure points (HH, HL, LL, LH)
Visual reference for potential breakout/breakdown levels
Customizable colors for bullish and bearish breaks
Fibonacci Retracement
Auto-drawn between the last two pivots
Customizable levels: 0, 0.236, 0.382, 0.5, 0.618, 0.786, 1.0
Individual toggle and color settings for each level
Multi-Timeframe Dashboard
Displays trend status across 3 customizable timeframes
Shows trend direction: Bullish / Bearish / Neutral
Shows confirmation status: Confirmed / Unconfirmed
Color-coded for quick visual analysis
Trend Confirmation Logic (ICT/SMC Concepts)
Bullish Confirmed: HL followed by HH (Higher Low → Higher High pattern)
Bearish Confirmed: LH followed by LL (Lower High → Lower Low pattern)
Unconfirmed: Counter-structure appears (potential reversal signal)
🔹 SETTINGS
Swing Settings
Depth: Lookback period for pivot detection
Display
Toggle zigzag lines, labels, price on labels
Adjust label size and number of visible swings
Zigzag Settings
Line style: Solid, Dashed, Dotted
Thickness and colors for bullish/bearish trends
Swing Trendlines
Toggle high/low trendlines independently
Customizable colors, style, thickness
Option to extend trendlines
Structure Trendlines
Toggle HH→LH and LL→HL lines independently
Customizable colors, style, thickness
Option to extend trendlines
Break Levels
Toggle HH, HL, LL, LH break levels independently
Customizable colors for each level
Fibonacci
Toggle individual fib levels
Customizable colors and line style
Dashboard
Position: Top Left, Top Right, Bottom Left, Bottom Right
Size: Tiny, Small, Normal, Large
3 customizable timeframes
🔹 ALERTS
HH Broken: Price breaks above recent Higher High
HL Broken: Price breaks below recent Higher Low
LL Broken: Price breaks below recent Lower Low
LH Broken: Price breaks above recent Lower High
🔹 USE CASES
✅ Identify market structure and trend direction
✅ Spot potential trend reversals (unconfirmed status)
✅ Find key support/resistance levels
✅ Multi-timeframe trend alignment for trade confirmation
✅ Breakout/breakdown trading with break levels
✅ Fibonacci retracement entries
3 hours ago
Release Notes
Swing elite Trend direction
A comprehensive market structure indicator that identifies swing highs/lows, labels them with HH/HL/LH/LL structure, draws dynamic trendlines, and provides multi-timeframe trend analysis.
🔹 FEATURES
Market Structure Analysis
Automatically detects swing highs and swing lows
Labels each pivot with its structure type: HH (Higher High), HL (Higher Low), LH (Lower High), LL (Lower Low)
Color-coded zigzag lines based on confirmed trend direction
Structure Trendlines
Downtrend Line: Connects HH to LH (resistance in bearish structure)
Uptrend Line: Connects LL to HL (support in bullish structure)
Extended projection for potential future price interaction
Swing Trendlines
Connects the last 2 swing highs (resistance trendline)
Connects the last 2 swing lows (support trendline)
Optional extension to project future levels
Break Levels
Horizontal lines at key structure points (HH, HL, LL, LH)
Visual reference for potential breakout/breakdown levels
Customizable colors for bullish and bearish breaks
Fibonacci Retracement
Auto-drawn between the last two pivots
Customizable levels: 0, 0.236, 0.382, 0.5, 0.618, 0.786, 1.0
Individual toggle and color settings for each level
Multi-Timeframe Dashboard
Displays trend status across 3 customizable timeframes
Shows trend direction: Bullish / Bearish / Neutral
Shows confirmation status: Confirmed / Unconfirmed
Color-coded for quick visual analysis
Trend Confirmation Logic (ICT/SMC Concepts)
Bullish Confirmed: HL followed by HH (Higher Low → Higher High pattern)
Bearish Confirmed: LH followed by LL (Lower High → Lower Low pattern)
Unconfirmed: Counter-structure appears (potential reversal signal)
🔹 SETTINGS
Swing Settings
Depth: Lookback period for pivot detection
Display
Toggle zigzag lines, labels, price on labels
Adjust label size and number of visible swings
Zigzag Settings
Line style: Solid, Dashed, Dotted
Thickness and colors for bullish/bearish trends
Swing Trendlines
Toggle high/low trendlines independently
Customizable colors, style, thickness
Option to extend trendlines
Structure Trendlines
Toggle HH→LH and LL→HL lines independently
Customizable colors, style, thickness
Option to extend trendlines
Break Levels
Toggle HH, HL, LL, LH break levels independently
Customizable colors for each level
Fibonacci
Toggle individual fib levels
Customizable colors and line style
Dashboard
Position: Top Left, Top Right, Bottom Left, Bottom Right
Size: Tiny, Small, Normal, Large
3 customizable timeframes
🔹 ALERTS
HH Broken: Price breaks above recent Higher High
HL Broken: Price breaks below recent Higher Low
LL Broken: Price breaks below recent Lower Low
LH Broken: Price breaks above recent Lower High
🔹 USE CASES
✅ Identify market structure and trend direction
✅ Spot potential trend reversals (unconfirmed status)
✅ Find key support/resistance levels
✅ Multi-timeframe trend alignment for trade confirmation
✅ Breakout/breakdown trading with break levels
✅ Fibonacci retracement entries
3 hours ago
Release Notes
Swing elite Trend direction
A comprehensive market structure indicator that identifies swing highs/lows, labels them with HH/HL/LH/LL structure, draws dynamic trendlines, and provides multi-timeframe trend analysis.
🔹 FEATURES
Market Structure Analysis
Automatically detects swing highs and swing lows
Labels each pivot with its structure type: HH (Higher High), HL (Higher Low), LH (Lower High), LL (Lower Low)
Color-coded zigzag lines based on confirmed trend direction
Structure Trendlines
Downtrend Line: Connects HH to LH (resistance in bearish structure)
Uptrend Line: Connects LL to HL (support in bullish structure)
Extended projection for potential future price interaction
Swing Trendlines
Connects the last 2 swing highs (resistance trendline)
Connects the last 2 swing lows (support trendline)
Optional extension to project future levels
Break Levels
Horizontal lines at key structure points (HH, HL, LL, LH)
Visual reference for potential breakout/breakdown levels
Customizable colors for bullish and bearish breaks
Fibonacci Retracement
Auto-drawn between the last two pivots
Customizable levels: 0, 0.236, 0.382, 0.5, 0.618, 0.786, 1.0
Individual toggle and color settings for each level
Multi-Timeframe Dashboard
Displays trend status across 3 customizable timeframes
Shows trend direction: Bullish / Bearish / Neutral
Shows confirmation status: Confirmed / Unconfirmed
Color-coded for quick visual analysis
Trend Confirmation Logic (ICT/SMC Concepts)
Bullish Confirmed: HL followed by HH (Higher Low → Higher High pattern)
Bearish Confirmed: LH followed by LL (Lower High → Lower Low pattern)
Unconfirmed: Counter-structure appears (potential reversal signal)
🔹 SETTINGS
Swing Settings
Depth: Lookback period for pivot detection
Display
Toggle zigzag lines, labels, price on labels
Adjust label size and number of visible swings
Zigzag Settings
Line style: Solid, Dashed, Dotted
Thickness and colors for bullish/bearish trends
Swing Trendlines
Toggle high/low trendlines independently
Customizable colors, style, thickness
Option to extend trendlines
Structure Trendlines
Toggle HH→LH and LL→HL lines independently
Customizable colors, style, thickness
Option to extend trendlines
Break Levels
Toggle HH, HL, LL, LH break levels independently
Customizable colors for each level
Fibonacci
Toggle individual fib levels
Customizable colors and line style
Dashboard
Position: Top Left, Top Right, Bottom Left, Bottom Right
Size: Tiny, Small, Normal, Large
3 customizable timeframes
🔹 ALERTS
HH Broken: Price breaks above recent Higher High
HL Broken: Price breaks below recent Higher Low
LL Broken: Price breaks below recent Lower Low
LH Broken: Price breaks above recent Lower High
🔹 USE CASES
✅ Identify market structure and trend direction
✅ Spot potential trend reversals (unconfirmed status)
✅ Find key support/resistance levels
✅ Multi-timeframe trend alignment for trade confirmation
✅ Breakout/breakdown trading with break levels
✅ Fibonacci retracement entries
Script su invito
Solo gli utenti approvati dall'autore possono accedere a questo script. È necessario richiedere e ottenere l'autorizzazione per utilizzarlo. Tale autorizzazione viene solitamente concessa dopo il pagamento. Per ulteriori dettagli, seguire le istruzioni dell'autore riportate di seguito o contattare direttamente Swing_elite.
TradingView NON consiglia di acquistare o utilizzare uno script a meno che non si abbia piena fiducia nel suo autore e se ne comprenda il funzionamento. È inoltre possibile trovare alternative gratuite e open source nei nostri script della community.
Istruzioni dell'autore
Declinazione di responsabilità
Script su invito
Solo gli utenti approvati dall'autore possono accedere a questo script. È necessario richiedere e ottenere l'autorizzazione per utilizzarlo. Tale autorizzazione viene solitamente concessa dopo il pagamento. Per ulteriori dettagli, seguire le istruzioni dell'autore riportate di seguito o contattare direttamente Swing_elite.
TradingView NON consiglia di acquistare o utilizzare uno script a meno che non si abbia piena fiducia nel suo autore e se ne comprenda il funzionamento. È inoltre possibile trovare alternative gratuite e open source nei nostri script della community.