Seasonalities Pro
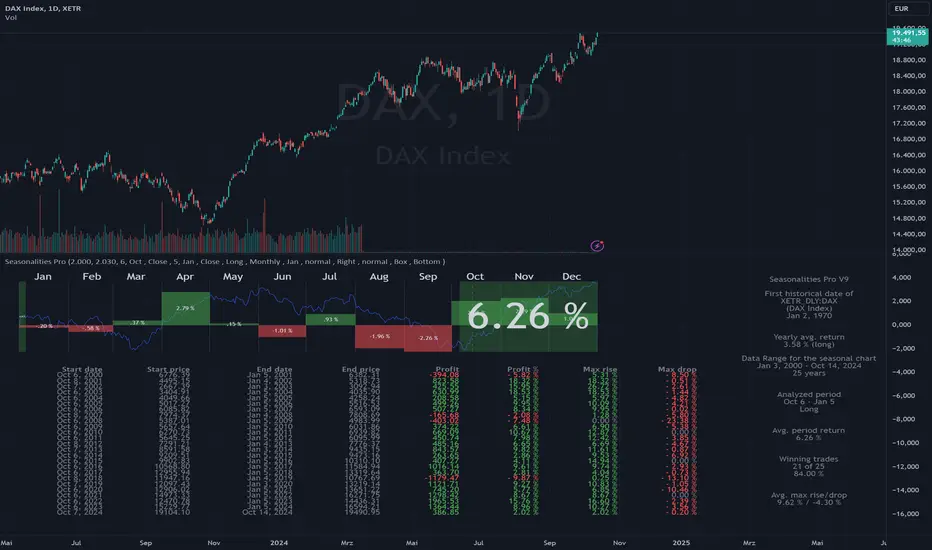
- Identification of seasonal investment opportunities
- Easy to use without prior knowledge with just a few clicks
- Statistical evaluation over an adjustable data basis (5 to 40 years)
- Period to be considered also across year boundaries
- Applicable to all instruments/symbols (indices, stocks, commodities, currencies, cryptos) that TradingView provides
- Best price/performance ratio
Differences between Lite and Pro
Pro: Evaluation of all symbols available at TradingView up to 40 years in the past.
Lite: Like Pro, but only "DAX", "SPX" and "NDX" up to 40 years in the past, all other symbols 5 years.
Der Seasonalities Pro Indikator für TradingView – saisonale Muster erkennen, auswerten und nutzen
- Identifizierung von saisonalen Investmentmöglichkeiten
- Einfache Anwendung ohne Vorkenntnisse mit wenigen Klicks
- Statistische Auswertung über eine einstellbare Datenbasis (5 bis 40 Jahre)
- Zu betrachtende Periode auch über die Jahresgrenze hinweg
- Anwendbar auf alle Instrumente/Symbole (Indizes, Aktien, Rohstoffe, Währungen, Cryptos) die TradingView zur Verfügung stellt
- Bestes Preis-/Leistungsverhältnis
Unterschiede zwischen Lite und Pro
Pro: Auswertung aller bei TradingView verfügbaren Symbole bis zu 40 Jahre in die Vergangenheit
Lite: Wie Pro, jedoch nur "DAX", "SPX" und "NDX" bis zu 40 Jahre in die Vergangenheit, alle anderen Symbole 5 Jahre.
- Period for the calculation of the seasonal chart can now be done via the specific inputs of year numbers. Thus, the limitation of 40 years is also removed.
- Display of the symbol name in the table at the right margin.
Deutsch
- Periode für die Berechnung des saisonalen Charts kann nun über die gezielte Eingaben von Jahreszahlen erfolgen. Somit ist auch die Begrenzung von 40 Jahre aufgehoben.
- Anzeige des Symbolnamens in der Tabelle am rechten Rand.
English
Fixed a bug when start year was <= year of first historical date.
Deutsch
Fehlerbhebung wenn das Startjahr <= dem Jahr der ersten historischen Daten gewesen ist.
Neu: Anleitungsvideo auf Deutsch: LINK
- Bug fix for chart calculation when end year is greater than current year.
- Default setting for end year set to 2030.
- Spacing is dynamically adjusted to chart size.
- Additional setting of Close/Open for start and end.
- Position of the overview table can now be set to right or top.
Deutsch
- Fehlerbehebung für die Berechnung des Chart, wenn Endjahr größer dem aktuellem Jahr ist.
- Standardeinstellung für Endjahr auf 2030 gesetzt.
- Abstände werden dynamisch an Chart-Größe angepasst.
- Zusätzliche Einstellung von Close/Open für Start und Ende.
- Position der Übersichttabelle nun einstellbar rechts oder oben.
Buy at Digistore24
- Display "Yearly average return" added:
- Display "Average return" changed to "Average period return":
- Added Tooltips for "Yearly average return" and "Average return".
- Added setting "Show current date".
- Added setting "Exclude Covid-V".
- Added setting "Show monthly return".
Deutsch
- Anzeige „Yearly average return” hinzugefügt.
- Anzeige „Average return” in „Average period return” geändert.
- Tooltips für „Yearly average return" und „Average return” hinzugefügt.
- Einstellung „Show current date“ hinzugefügt.
- Einstellung „Exclude Covid-V“ hinzugefügt.
- Einstellung „Show monthly return“ hinzugefügt.
English
- Setting of text sizes added.
- Display of the results table "top" adjusted.
Deutsch
- Einstellung von Textgrößen hinzugefügt.
- Aufteilung für die Darstellung der Ergebnis-Tabelle "top" angepasst.
English
- Selection of chart text color to be able to set a suitable color depending on the background.
- Trade type (long or short) added in the settings and calculation of trades and summary adjusted accordingly.
- Result Table position added to "None" to turn it off.
- Period Table can be switched on and off.
- Bug fixing when displaying monthly returns if their value is larger than the seasonal chart. In this case the monthly returns extended beyond the chart into the month labels.
- Check if the indicator is called in the daily timeframe.
- Result table implemented as table instead of box (parameter).
- format.mintick used for start price, end price and profit.
- Avg. max rise/drop added.
- Display of "Avg. period return" directly in the chart.
Deutsch
- Auswahl der Chart-Text-Farbe, um je nach Hintergrund eine passende Farbe einstellen zu können.
- Trade type (Long oder Short) in den Einstellungen hinzugefügt und Berechnung der Trades und der Zusammenfassung entsprechend angepasst.
- Result Table Position um "None" ergänzt, um diese auszuschalten.
- Period Table ein- und ausschaltbar.
- Bug-Behebung beim Anzeigen der Monthly Returns, wenn deren Wert größer als der saisonale Chart sind. In diesem Fall ragten die Monthly Return über den Chart hinaus in die Monats-Bezeichnungen hinein.
- Überprüfung, ob der Indikator im daily timeframe aufgerufen wird.
- Result Table als Table anstatt als Box umgesetzt (Parameter).
- format.mintick für start price, end price und profit verwendet.
- Avg. max rise/drop hinzugefügt.
- Anzeige von "Avg. period return" direkt im Chart.
Anleitungsvideo auf Deutsch: LINK
Pro-Version: Digistore24
English
- Color of chart line adjustable.
- "show_avg_period_return" added.
- Added „left“ to "result_table_pos".
- Added parameter "First month".
- Added quarterly performance analysis.
Deutsch
- Farbe der Chart Linie einstellbar.
- "show_avg_period_return" hinzugefügt.
- "result_table_pos" um "Left " ergänzt.
- Einstellung "First month" hinzugefügt.
- Quarterly performance analysis hinzugefügt.
Anleitungsvideo auf Deutsch: LINK
Pro-Version: Digistore24
Script su invito
Solo gli utenti approvati dall'autore possono accedere a questo script. È necessario richiedere e ottenere l'autorizzazione per utilizzarlo. Tale autorizzazione viene solitamente concessa dopo il pagamento. Per ulteriori dettagli, seguire le istruzioni dell'autore riportate di seguito o contattare direttamente funcharts.
TradingView NON consiglia di acquistare o utilizzare uno script a meno che non si abbia piena fiducia nel suo autore e se ne comprenda il funzionamento. È inoltre possibile trovare alternative gratuite e open source nei nostri script della community.
Istruzioni dell'autore
Declinazione di responsabilità
Script su invito
Solo gli utenti approvati dall'autore possono accedere a questo script. È necessario richiedere e ottenere l'autorizzazione per utilizzarlo. Tale autorizzazione viene solitamente concessa dopo il pagamento. Per ulteriori dettagli, seguire le istruzioni dell'autore riportate di seguito o contattare direttamente funcharts.
TradingView NON consiglia di acquistare o utilizzare uno script a meno che non si abbia piena fiducia nel suo autore e se ne comprenda il funzionamento. È inoltre possibile trovare alternative gratuite e open source nei nostri script della community.