OPEN-SOURCE SCRIPT
Aggiornato Portfolio SnapShot v0.3
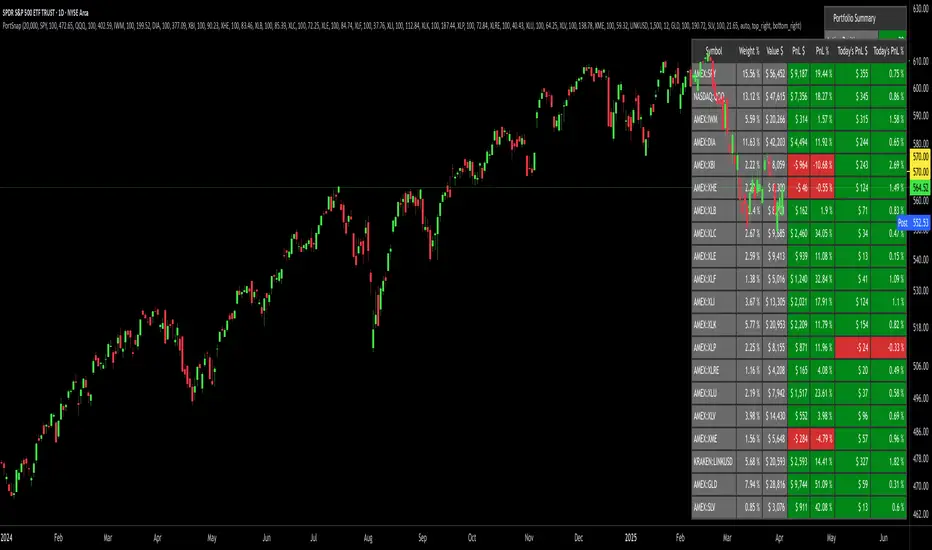
Here is a Tradingview Pinescript that I call "Portfolio Snapshot". It is based on two other separate scripts that I combined, modified and simplified - shoutout to RedKTrader (Portfolio Tracker - Table Version) and FriendOfTheTrend (Portfolio Tracker For Stocks & Crypto) for their inspiration and code. I was using both of these scripts, and decided to combine the two and increase the number of stocks to 20. I was looking for an easy way to track my entire portfolio (scattered across 5 accounts) PnL on a total and stock basis. PnL - that's it, very simple by design. The features are:
1) Track PnL across multiple accounts, from inception and current day.
2) PnL is reported in two tables, at the portfolio level and individual stock level
3) Both tables can be turned on/off and placed anywhere on the chart.
4) Input up to 20 assets (stocks, crypto, ETFs)
The user has to manually calculate total shares and average basis for stocks in multiple accounts, and then inputs this in the user input dialog. I update mine as each trade is made, or you can just update once a week or so.
I've pre-loaded it with the major indices and sector ETFs, plus URA, GLD, SLV. 100 shares of each, and prices are based on the close Jan 2 2024. So if you don't want to track your portfolio, you can use it to track other things you find interesting, such as annual performance of each sector.
Note di rilascio
v0.4 UPDATEUPDATE: Note that I have made a new version (0.4) that adjusts how the "Gain $" is calculated. I noticed that the Gain value was different depending on if a stock or crypto was displayed on the chart, as they have different trading hours and reference times. A small change has been made to this calculation, so now all Gain calculations should use the Daily timeframe, and should be consistent no matter what is displayed on the chart.
Here is a Tradingview Pinescript that I call "Portfolio Snapshot". It is based on two other separate scripts that I combined, modified and simplified - shoutout to RedKTrader (Portfolio Tracker - Table Version) and FriendOfTheTrend (Portfolio Tracker For Stocks & Crypto) for their inspiration and code. I was using both of these scripts, and decided to combine the two and increase the number of stocks to 20. I was looking for an easy way to track my entire portfolio (scattered across 5 accounts) PnL on a total and stock basis. PnL - that's it, very simple by design. The features are:
1) Track PnL across multiple accounts, from inception and current day.
2) PnL is reported in two tables, at the portfolio level and individual stock level
3) Both tables can be turned on/off and placed anywhere on the chart.
4) Input up to 20 assets (stocks, crypto, ETFs)
The user has to manually calculate total shares and average basis for stocks in multiple accounts, and then inputs this in the user input dialog. I update mine as each trade is made, or you can just update once a week or so.
I've pre-loaded it with the major indices and sector ETFs, plus URA, GLD, SLV. 100 shares of each, and prices are based on the close Jan 2 2024. So if you don't want to track your portfolio, you can use it to track other things you find interesting, such as annual performance of each sector.
Script open-source
Nello spirito di TradingView, l'autore di questo script lo ha reso open source, in modo che i trader possano esaminarne e verificarne la funzionalità. Complimenti all'autore! Sebbene sia possibile utilizzarlo gratuitamente, ricordiamo che la ripubblicazione del codice è soggetta al nostro Regolamento.
Declinazione di responsabilità
Le informazioni e le pubblicazioni non sono intese come, e non costituiscono, consulenza o raccomandazioni finanziarie, di investimento, di trading o di altro tipo fornite o approvate da TradingView. Per ulteriori informazioni, consultare i Termini di utilizzo.