OPEN-SOURCE SCRIPT
Aggiornato Constance Brown RSI

*Re-uploading without House Violations*
Welles Wilder created the RSI momentum oscillator in the 1970s. It is a momentum oscillator that ranges from 0 to 100. The traditional idea is to buy when the oscillator is below 30 and to sell when it is above 70. However, this strategy often only catches extreme moves and misses majority of the trend.
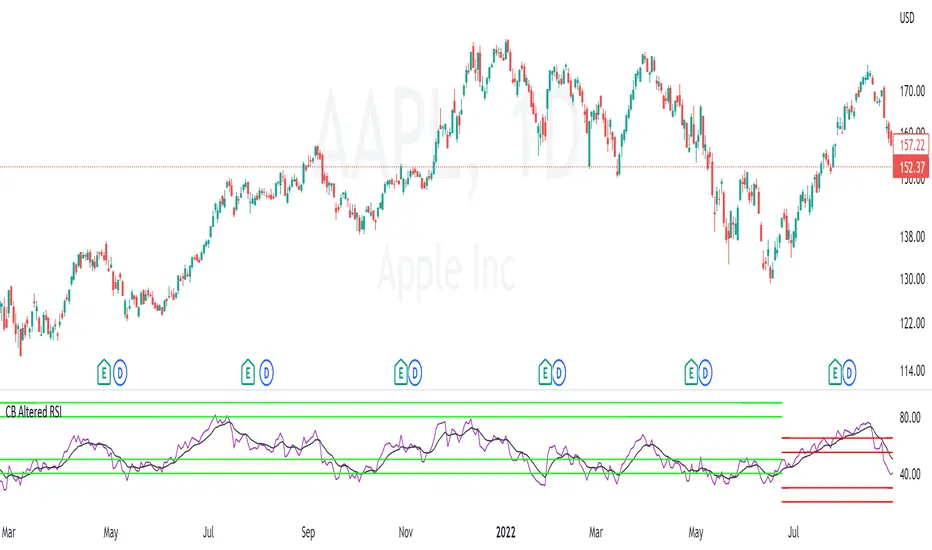
In comes Constance Brown RSI . She theorized that in an uptrend, the buy zone exists when RSI is between 40 and 50. The sell zone in an uptrend exists between 80 and 90. In a downtrend, the sell zone exists between 55 and 65. The buy zone in a downtrend exists between 20 and 30.
I have added a moving average feature to determine trend. When the short trend is above the long trend, it is considered an uptrend. It is in a downtrend otherwise. Using short length moving averages will often produce a lot of false signals. I recommend using the 50 and 100 as they will produce less noise.
There will be times when the oscillator breaks beyond the ranges described (for ex: seeing a reading below 40 in an uptrend). This tends to happen in periods of high volatility . Refer to the traditional RSI rules in such cases.
https://www.tradingview.com/x/of8R82ie
Note di rilascio
Added an EMA signal line. Buy the crossover from the support zone in an uptrend and sell the crossunder from the resistance zone in a downtrend. Script open-source
In pieno spirito TradingView, il creatore di questo script lo ha reso open-source, in modo che i trader possano esaminarlo e verificarne la funzionalità. Complimenti all'autore! Sebbene sia possibile utilizzarlo gratuitamente, ricorda che la ripubblicazione del codice è soggetta al nostro Regolamento.
Declinazione di responsabilità
Le informazioni ed i contenuti pubblicati non costituiscono in alcun modo una sollecitazione ad investire o ad operare nei mercati finanziari. Non sono inoltre fornite o supportate da TradingView. Maggiori dettagli nelle Condizioni d'uso.
Script open-source
In pieno spirito TradingView, il creatore di questo script lo ha reso open-source, in modo che i trader possano esaminarlo e verificarne la funzionalità. Complimenti all'autore! Sebbene sia possibile utilizzarlo gratuitamente, ricorda che la ripubblicazione del codice è soggetta al nostro Regolamento.
Declinazione di responsabilità
Le informazioni ed i contenuti pubblicati non costituiscono in alcun modo una sollecitazione ad investire o ad operare nei mercati finanziari. Non sono inoltre fornite o supportate da TradingView. Maggiori dettagli nelle Condizioni d'uso.