FibVIP2022TSLA
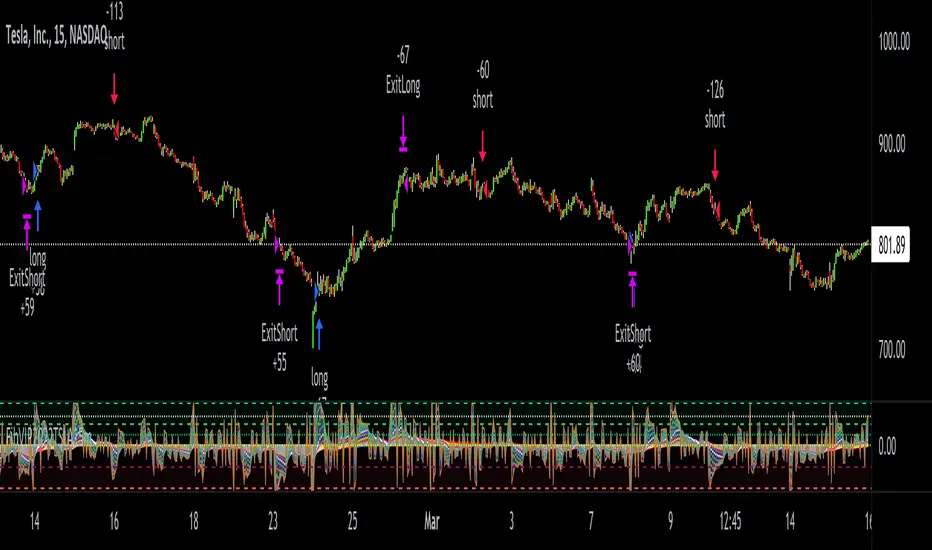
It's based on my Fibonacci VIP indicator script. Fibonacci VIP (Fibonacci Volume Indicator Precision) is a volume indicator that I made to help me have precise entry and exit timing. It's based on the well-known Fibonacci sequence 1, 2, 3, 5, 8, 13, 21, 34, 55, 89, 144, 233. The default colors I like to use can be changed to whatever you want. The numbers inputted are based on volume ema.
Bullish momentum in ascending order is 21 = white, 13 = blue, 8 = green.
Bearish momentum descending order is 89 = red, 55 = yellow, 34 = purple.
Immediate momentum 1 = orange, 2 = blue, 3 = neon green, 5 = lime.
Long term momentum 144 = lime, 233 = teal.
Four high, mid high, mid low & low dashed channel lines with transparent fill colors lime, green, maroon & red. Also, there's a gray zero static line & white dynamic horizontal dotted line ema1 & ema8 to help keep momentum in perspective. The most bullish signal is when all colors are in a top-down order 1, 2, 3, 5, 8, 13, 21, 34, 55, 89, 144, 233. The most bearish signal is when all colors are reversed and have a bottom-up order of 233, 144, 89, 55, 34, 21, 13, 8, 5, 3, 2, 1.
A crossover, cross-under, divergence or convergence of these colors, help signal the future price action. For example, green crossing over red is bullish, but green crossing under red is bearish. If colors are low / below the zero line that's bearish and if they are above the zero line, that's bullish. The FibVIP works great as a leading indicator to confirm future price action of the underlying security momentum.
Script su invito
Solo gli utenti approvati dall'autore possono accedere a questo script. È necessario richiedere e ottenere l'autorizzazione per utilizzarlo. Tale autorizzazione viene solitamente concessa dopo il pagamento. Per ulteriori dettagli, seguire le istruzioni dell'autore riportate di seguito o contattare direttamente Options360.
TradingView NON consiglia di acquistare o utilizzare uno script a meno che non si abbia piena fiducia nel suo autore e se ne comprenda il funzionamento. È inoltre possibile trovare alternative gratuite e open source nei nostri script della community.
Istruzioni dell'autore
tradingview.com/u/Options360/
Declinazione di responsabilità
Script su invito
Solo gli utenti approvati dall'autore possono accedere a questo script. È necessario richiedere e ottenere l'autorizzazione per utilizzarlo. Tale autorizzazione viene solitamente concessa dopo il pagamento. Per ulteriori dettagli, seguire le istruzioni dell'autore riportate di seguito o contattare direttamente Options360.
TradingView NON consiglia di acquistare o utilizzare uno script a meno che non si abbia piena fiducia nel suo autore e se ne comprenda il funzionamento. È inoltre possibile trovare alternative gratuite e open source nei nostri script della community.
Istruzioni dell'autore
tradingview.com/u/Options360/