OPEN-SOURCE SCRIPT
Aggiornato GCM Heikin Ashi with Pivots
Title: GCM Heikin Ashi with Pivots
Description:
Overview
This indicator provides a powerful combination of trend visualization, precise reversal signals, and volume confirmation in a clean, customizable sub-chart. It is designed to help traders identify trend momentum using Heikin Ashi candles, pinpoint confirmed swing highs and lows (pivots), and spot surges in buying pressure with our unique Volume Rate-of-Change (VROC) highlighter.
The key feature of this script is its non-repainting pivot signals. A pivot high or low is only confirmed and plotted after a specific number of subsequent bars have closed, ensuring the signals are reliable and do not change after they appear.
Key Features
Heikin Ashi Sub-Chart: Displays smoothed Heikin Ashi candles in a separate pane to clearly visualize trend strength and direction without cluttering the main price chart.
Non-Repainting Pivot Signals: Uses ta.pivothigh and ta.pivotlow to identify confirmed swing points. The signals will not repaint or move once they are printed on the chart.
Smart Volume Spike Analysis (VROC): A Heikin Ashi candle will be highlighted in a distinct bright green (#2dff00) when the volume increases significantly on a bullish price candle. This "volume-confirmed" candle can signal strong conviction behind a move.
Complete Label Customization: Take full control over the look and feel of your signals:
Label Mode: Choose between "High & Low" (H/L) or "Buy & Sell" (B/S) to match your trading terminology.
Custom Colors: Set unique colors for both the high and low pivot labels.
Label Style: Select from various shapes like boxes, circles, diamonds, or squares.
Label Size: Adjust the size of the labels from Tiny to Huge for perfect visibility.
Adjustable Pivot Sensitivity: Fine-tune the pivot detection algorithm by setting the number of bars required to the left (strength) and right (confirmation) of a pivot point.
How to Use & Interpret the Signals
Assess the Trend with Heikin Ashi:
A series of green HA candles with little to no lower wicks indicates strong bullish momentum.
A series of red HA candles with little to no upper wicks indicates strong bearish momentum.
Look for Volume Confirmation:
A bright green highlighted candle signals a surge in buying pressure (VROC spike). This adds significant weight to bullish moves and can act as a leading indicator for a new leg up.
Identify Entry/Exit Points with Pivot Labels:
An "L" or "B" label marks a confirmed swing low. This is a potential buying opportunity, especially if it is followed by green Heikin Ashi candles and, ideally, a bright green VROC spike candle.
An "H" or "S" label marks a confirmed swing high. This is a potential selling/shorting opportunity, especially as HA candles turn red.
Example Strategy (High-Confluence)
A powerful way to use this indicator is to look for a sequence of events:
Wait for a "Buy" (B) or "Low" (L) signal to appear, confirming a bottom has likely formed.
Wait for the first bright green VROC spike candle to appear after the signal. This confirms that buyers are stepping in with conviction.
Consider an entry based on this high-confluence setup, using the swing low as a potential stop-loss area.
Settings Explained
Pivot Detection:
Left Bars (Strength): Number of bars to the left of a pivot. A higher number finds more significant pivots.
Right Bars (Confirmation): Number of bars to the right required to confirm a pivot. This creates a lag for reliability.
Volume Spike Detection (VROC):
Enable Volume Spike Highlighting: Turn the bright green candle highlight on or off.
VROC Length: The lookback period for calculating the volume's rate of change.
VROC Threshold %: The percentage volume must increase to trigger a highlight.
Label Customization:
Label Text Mode: Choose between "High & Low" or "Buy & Sell".
Label Color, Style, and Size: Full cosmetic control for the pivot labels.
Final Note
This indicator is a tool to aid in technical analysis and should not be used as a standalone trading system. Always use it in conjunction with other analysis methods, proper risk management, and a sound trading plan.
Enjoy!
Note di rilascio
Updates:Added the code for the highlighted candle signals a surge in selling pressure (VROC spike) same as a bright green highlighted candle signals a surge in buying pressure (VROC spike) in previous version
Thank you
Note di rilascio
More updates,Added Overbought and Oversold parameters, Changes made for Price values to Oscillation Values
Now this indicator shows more accurate and perfect trend waves
Note di rilascio
Release Notes (For the Update):Title: GCM Heikin Ashi with Pivots
Introducing the Dynamic Scalper Line & Major Visual Overhaul!
Description:
This is our biggest update yet, based on fantastic user feedback! We've completely redesigned the core trend component to be cleaner, faster, and more predictive.
Key Changes & Updates:
• NEW - Dynamic Scalper Line: The new "Dynamic Scalper Line." It now functions as a dedicated trend-following sub-chart.
• NEW - Predictive Diamond Signals: Tiny green and red diamonds now appear to signal a trend change. Crucially, they are plotted on the last candle of the previous trend to give you an earlier heads-up.
• IMPROVED - Visuals & Clarity:
o The Scalper Line colors are now highlighted for better visibility.
o All level lines (Overbought, Oversold, etc.) are now a clean, dotted style by default to reduce noise.
• SIMPLIFIED - Cleaner Settings: We've streamlined the input settings for a more focused user experience.
• FIXED: Addressed minor bugs and optimized plotting for smoother performance.
Thank you for your continued support and feedback that drove these improvements. Happy trading
Note di rilascio
Scalpers now Blindly follow the Scalping line signalsNote di rilascio
Alert Added for pivots and Dynamic Scalper Line buy-sell signalsNote di rilascio
NEW UPDATEAMAZING SCALPER BAR CREATED FOR OPTION BUYERS AND SELLERS
Note di rilascio
GCM Heikin Ashi with Pivots Update: Trend-Focused Pivot Detection!
Hello traders!
This is a significant update to the GCM Heikin Ashi with Pivots indicator, designed to improve the quality and reliability of its core signals. We've reworked the pivot detection logic to better align with the philosophy of Heikin Ashi charts.
Key Change: Pivot Calculation Reworked
The core logic for detecting pivot highs and lows has been fundamentally updated.
Old Method: The indicator used the traditional candle high and low (the wicks) to identify pivots. This is known as the orthodox method.
New Method: The indicator now identifies pivots based exclusively on the Heikin Ashi Close price (ha_close).
Why This Change? (The Benefits)
Focus on Trend, Not Noise: Standard pivots are sensitive to sharp price spikes and long wicks, which can often be market noise or stop-hunts. By using the ha_close, the pivots are now aligned with the core momentum and trend direction inherent to Heikin Ashi candles.
Smoother, More Reliable Signals: This change results in a smoother, less erratic identification of trend turning points. You should notice fewer "false" pivots caused by temporary volatility that doesn't affect the underlying trend.
True to Heikin Ashi: The primary purpose of Heikin Ashi is to filter out market noise. This update brings the pivot detection method in line with that core philosophy, making the entire indicator more internally consistent and robust.
How This Affects You
Signal Location: Pivot points (and the corresponding "H" / "L" labels) will now be marked based on the highest or lowest Heikin Ashi close in a given period, not the absolute peak of the wick.
Strategy Adjustment: Because the pivots are now less sensitive to extreme wicks, they act more as trend confirmation points rather than exact price reversal levels. You may need to adjust your strategy accordingly.
Alerts: The Pivot HIGH Confirmed and Pivot LOW Confirmed alerts will now trigger based on this new, more robust logic.
We believe this update makes the GCM HAP a more powerful and reliable tool for trend analysis. As always, we welcome your feedback in the comments.
Happy trading
Note di rilascio
GCM Heikin Ashi with Pivots UPDATES DETAIL
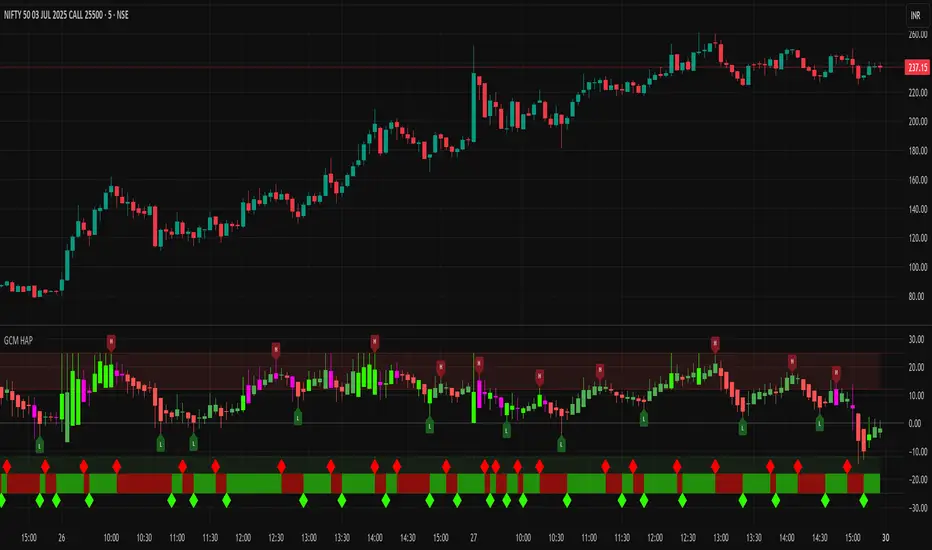
The GCM Heikin Ashi with Pivots is a comprehensive momentum oscillator designed to provide a clear, visual representation of trend strength, key reversal points, and unusual volume activity, all within a single, easy-to-read indicator pane.
It normalizes Heikin Ashi price action into a wave-like oscillator, making it simple to identify the underlying trend and potential entry or exit opportunities.
Key Features:
Heikin Ashi Wave: The core of the indicator is a smoothed oscillator based on Heikin Ashi candles, which filters out market noise and clearly displays bullish or bearish momentum.
Scalper Bar & Diamond Signals: A real-time "Scalper Bar" at the top or bottom of the pane provides an at-a-glance view of the current momentum.
A Green Diamond appears when momentum shifts bullish (a potential buy signal).
A Red Diamond appears when momentum shifts bearish (a potential sell signal).
Confirmed Pivot Points: Automatically identifies and labels confirmed structural highs ('H') and lows ('L') based on the Heikin Ashi close price, helping you spot key market structure and potential trend reversals.
Volume Spike Detection: Highlights candles with unusually high volume (based on VROC), adding another layer of conviction to price moves.
Fully Customizable Alerts: Create alerts for both the real-time Scalper Bar signals and the confirmed Pivot Point signals.
Deep Customization: Nearly every visual element—from colors and levels to pivot strength and label styles—can be customized in the organized settings panel to fit your personal trading style.
How to Use
For Scalping/Momentum: Use the Scalper Bar and Diamond Signals. A green diamond suggests bullish momentum is starting, while a red diamond suggests bearish momentum is beginning. The colored bar confirms the current, real-time momentum.
For Swing/Structure Trading: Pay attention to the 'H' (High) and 'L' (Low) pivot labels. These mark confirmed tops and bottoms in the market structure and can serve as excellent points for setting stop-losses or identifying a larger trend change.
For Confirmation: Use the Volume Spike highlights. A large volume spike on a candle that aligns with your trade direction (e.g., a buy signal with a high-volume green candle) can increase the probability of a successful trade.
Recent Updates
Increased History: The number of historical signals (diamonds and pivots) has been increased to the platform maximum of 500, allowing you to analyze much more past data.
Thicker Scalper Bar: The default thickness of the Scalper Bar has been increased to 7.0 for better visibility.
Refined Signal Placement: The diamond signals have been perfectly positioned to sit just outside the Scalper Bar, with only the tip of the diamond touching the bar's edge for a clean, precise look.
Improved Settings Panel: All settings related to the Scalper Bar and its signals have been organized into a single, intuitive group for easier configuration.
Script open-source
Nello spirito di TradingView, l'autore di questo script lo ha reso open source, in modo che i trader possano esaminarne e verificarne la funzionalità. Complimenti all'autore! Sebbene sia possibile utilizzarlo gratuitamente, ricordiamo che la ripubblicazione del codice è soggetta al nostro Regolamento.
Declinazione di responsabilità
Le informazioni e le pubblicazioni non sono intese come, e non costituiscono, consulenza o raccomandazioni finanziarie, di investimento, di trading o di altro tipo fornite o approvate da TradingView. Per ulteriori informazioni, consultare i Termini di utilizzo.