OPEN-SOURCE SCRIPT
NSDT Double MA Shading
This script is an interesting take on Convergence and Divergence of Moving Averages. With the built-in MACD Indicator, you cannot make these adjustments to the settings.
DESCRIPTION
The top Moving Average is calculated on the High of the candle.
The bottom Move Average is calculated on the Low of the candle.
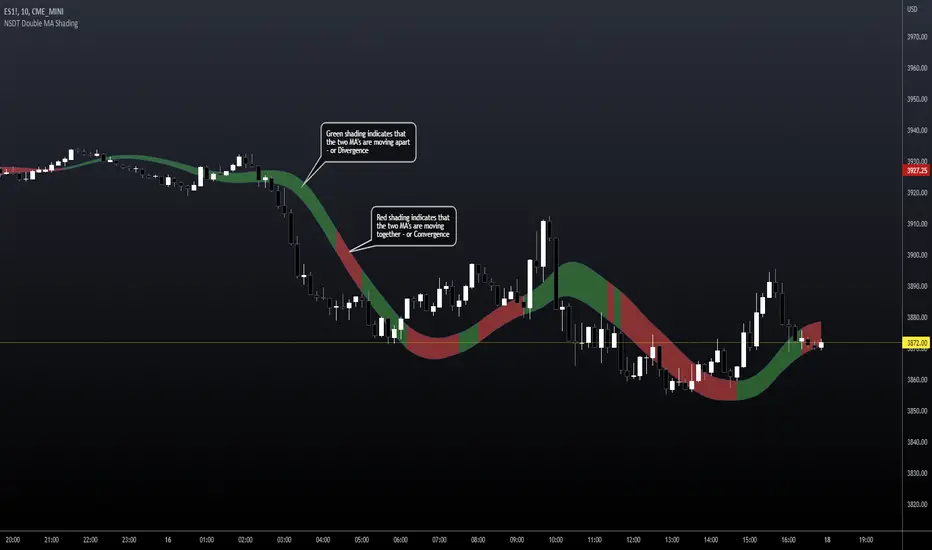
If the two are moving apart (Divergence), the shaded area between them turns Green.
If the two are moving together (Convergence), the shaded area between them turns Red.
This may help identify when a trend is becoming stronger or weaker, based on the shaded area and Moving Average direction.
POSSIBLE USAGE
For example:
If the MA's are pointing downward and the shaded area is Green - it means that average distance between the candle High and Low is getting wider, which may indicate a stronger downward movement. Then, when the shaded area turns Red, signaling the average distance between the candle High and Low are getting narrower, this may indicate that the downward movement is weakening, and may be the end of that downward trend.
SETTINGS
You can choose from EMA, SMA, WMA, RMA, HMA, TMA, and VWMA.
Although you can choose the MA Source, it is highly recommended to keep one source on the High of the candle and the other on the Low of the candle, for measure Convergence and Divergence.
All indicator settings are editable.
It can be used on Multi Timeframes (MTF).
This script is free and open source.
DESCRIPTION
The top Moving Average is calculated on the High of the candle.
The bottom Move Average is calculated on the Low of the candle.
If the two are moving apart (Divergence), the shaded area between them turns Green.
If the two are moving together (Convergence), the shaded area between them turns Red.
This may help identify when a trend is becoming stronger or weaker, based on the shaded area and Moving Average direction.
POSSIBLE USAGE
For example:
If the MA's are pointing downward and the shaded area is Green - it means that average distance between the candle High and Low is getting wider, which may indicate a stronger downward movement. Then, when the shaded area turns Red, signaling the average distance between the candle High and Low are getting narrower, this may indicate that the downward movement is weakening, and may be the end of that downward trend.
SETTINGS
You can choose from EMA, SMA, WMA, RMA, HMA, TMA, and VWMA.
Although you can choose the MA Source, it is highly recommended to keep one source on the High of the candle and the other on the Low of the candle, for measure Convergence and Divergence.
All indicator settings are editable.
It can be used on Multi Timeframes (MTF).
This script is free and open source.
Script open-source
Nello spirito di TradingView, l'autore di questo script lo ha reso open source, in modo che i trader possano esaminarne e verificarne la funzionalità. Complimenti all'autore! Sebbene sia possibile utilizzarlo gratuitamente, ricordiamo che la ripubblicazione del codice è soggetta al nostro Regolamento.
ALL indicators, strategies and bots are included with Discord access.
NorthStarDayTrading.com/discord
youtube.com/shorts/fWFQE7uEHvU
NorthStarDayTrading.com/discord
youtube.com/shorts/fWFQE7uEHvU
Declinazione di responsabilità
Le informazioni e le pubblicazioni non sono intese come, e non costituiscono, consulenza o raccomandazioni finanziarie, di investimento, di trading o di altro tipo fornite o approvate da TradingView. Per ulteriori informazioni, consultare i Termini di utilizzo.