OPEN-SOURCE SCRIPT
Aggiornato Shadow Range Index
Shadow Range Index (SRI) introduces a new concept to calculate momentum, shadow range.
What is range?
Traditionally, True Range (TR) is the current high minus the current low of each bar in the timeframe. This is often used successfully on its own in indicators, or as a moving average in ATR (Average True Range).
To calculate range, SRI uses an innovative calculation of current bar range that also considers the previous bar. It calculates the difference between its maximum upward and maximum downward values over the number of bars the user chooses (by adjusting ‘Range lookback’).
What is shadow range?
True Range (TR) uses elements in its calculation (the highs and lows of the bar) that are also visible on the chart bars. Shadow range does not, though.
SRI calculates shadow range in a similar formula to range, except that this time it works out the difference between the minimum upward and minimum downward movement. This movement is by its nature less than the maximums, hence a shadow of it. Although more subtle, shadow range is significant, because it is quantifiable, and goes in one direction or another.
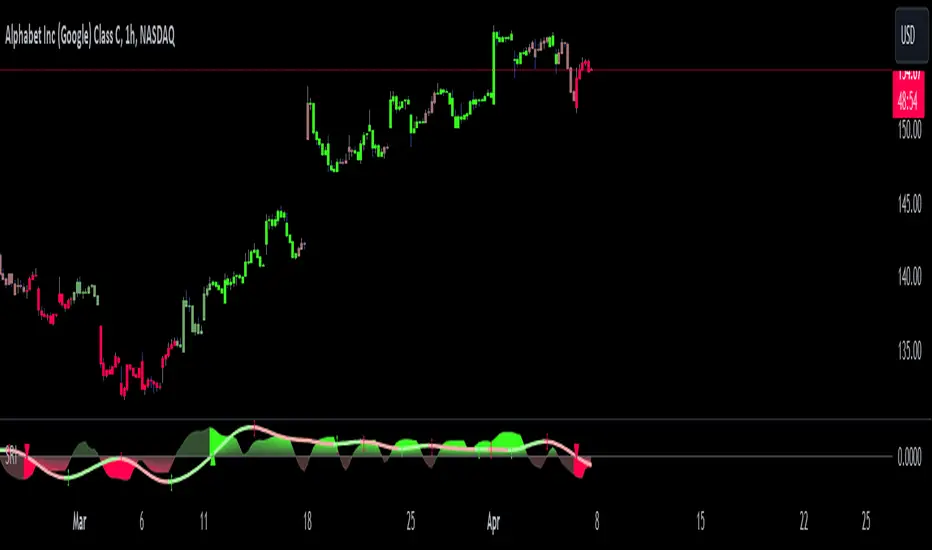
Finally, SRI smoothes shadow range and plots it as a histogram, and also smoothes and plots range as a signal line. Useful up and down triangles show trend changes, which optionally colour the chart bars.
Here’s an example of a long trade setup:

In summary, Shadow Range Index identifies and traces maximum and minimum bar range movement both up and down, and plots them as centred oscillators. The dynamics between the two can provide insights into the chart's performance and future direction.
Credit to these authors, whose MA or filters form part of this script:
balipour - Super Smoother MA
cheatcountry - Hann window smoothing
AlgoAlpha - Gaussian filter
What is range?
Traditionally, True Range (TR) is the current high minus the current low of each bar in the timeframe. This is often used successfully on its own in indicators, or as a moving average in ATR (Average True Range).
To calculate range, SRI uses an innovative calculation of current bar range that also considers the previous bar. It calculates the difference between its maximum upward and maximum downward values over the number of bars the user chooses (by adjusting ‘Range lookback’).
What is shadow range?
True Range (TR) uses elements in its calculation (the highs and lows of the bar) that are also visible on the chart bars. Shadow range does not, though.
SRI calculates shadow range in a similar formula to range, except that this time it works out the difference between the minimum upward and minimum downward movement. This movement is by its nature less than the maximums, hence a shadow of it. Although more subtle, shadow range is significant, because it is quantifiable, and goes in one direction or another.
Finally, SRI smoothes shadow range and plots it as a histogram, and also smoothes and plots range as a signal line. Useful up and down triangles show trend changes, which optionally colour the chart bars.
Here’s an example of a long trade setup:
In summary, Shadow Range Index identifies and traces maximum and minimum bar range movement both up and down, and plots them as centred oscillators. The dynamics between the two can provide insights into the chart's performance and future direction.
Credit to these authors, whose MA or filters form part of this script:
balipour - Super Smoother MA
cheatcountry - Hann window smoothing
AlgoAlpha - Gaussian filter
Note di rilascio
Added user control over all colour elements. Also, added theme:Note di rilascio
ALERTS added. Will trigger with trend change triangle symbols.Script open-source
In pieno spirito TradingView, il creatore di questo script lo ha reso open-source, in modo che i trader possano esaminarlo e verificarne la funzionalità. Complimenti all'autore! Sebbene sia possibile utilizzarlo gratuitamente, ricorda che la ripubblicazione del codice è soggetta al nostro Regolamento.
Declinazione di responsabilità
Le informazioni ed i contenuti pubblicati non costituiscono in alcun modo una sollecitazione ad investire o ad operare nei mercati finanziari. Non sono inoltre fornite o supportate da TradingView. Maggiori dettagli nelle Condizioni d'uso.
Script open-source
In pieno spirito TradingView, il creatore di questo script lo ha reso open-source, in modo che i trader possano esaminarlo e verificarne la funzionalità. Complimenti all'autore! Sebbene sia possibile utilizzarlo gratuitamente, ricorda che la ripubblicazione del codice è soggetta al nostro Regolamento.
Declinazione di responsabilità
Le informazioni ed i contenuti pubblicati non costituiscono in alcun modo una sollecitazione ad investire o ad operare nei mercati finanziari. Non sono inoltre fornite o supportate da TradingView. Maggiori dettagli nelle Condizioni d'uso.