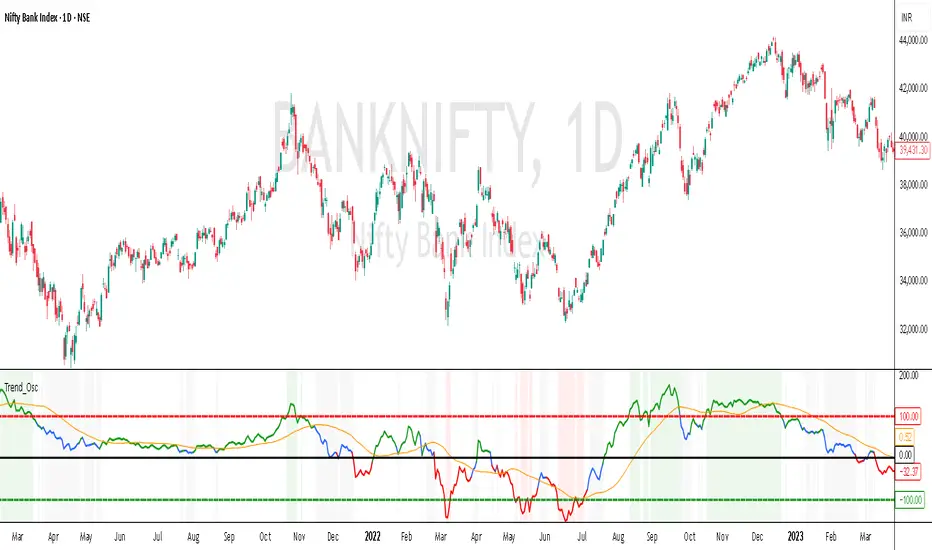
Trend Oscillator
## Overview
The Trend Oscillator is a sophisticated technical analysis tool designed to identify market trends, momentum shifts, and potential reversal points. Unlike basic oscillators, this indicator combines key analytical approaches to provide a more comprehensive market analysis:
1. **Mean Deviation-Based Oscillator**:(160) At its core, it measures price deviations from moving averages normalized by mean deviation
2. **Fixed Reference Levels**: Clear overbought/oversold thresholds that define extreme market conditions
3. **Trend Filtering**: EMA(36)-based trend direction confirmation to reduce false signals
## Technical Foundation
### Core Calculation Method
The indicator derives its primary oscillator value using a normalized deviation method:
- Calculates a typical price (average of source + high + low)
- Measures the deviation of typical price from its moving average
- Normalizes this deviation by the mean deviation multiplied by a scaling factor (0.015)
This formula effectively creates a momentum oscillator that quantifies how far price has moved from its equilibrium value, relative to typical market volatility.
### Fixed Overbought/Oversold Levels
The Trend Oscillator uses consistent reference levels to identify extreme market conditions:
- Standardized overbought level set at +100
- Standardized oversold level set at -100
- Neutral zone centered around the zero line
These fixed thresholds provide reliable reference points for signal generation and trend strength assessment.
### Trend Filtering Mechanism
The indicator incorporates an EMA-based trend filter that:
- Calculates a directional bias using price position relative to its EMA 36
- Modifies oscillator interpretation based on the prevailing trend
- Helps distinguish between counter-trend corrections and actual reversals
## How to Use the Trend Oscillator
### For Trend Identification
- **Bullish trend**: Oscillator above zero with positive slope
- **Bearish trend**: Oscillator below zero with negative slope
- **Trend strength**: Distance from zero line indicates trend intensity
- **Trend confirmation**: When oscillator and trend filter align
### For Entry Signals
- **Long entry opportunities**:
- Oscillator crossing above the signal line during uptrend
- Oscillator exiting oversold territory with trend filter positive
- Price showing strength while oscillator moves from negative to positive
- **Short entry opportunities**:
- Oscillator crossing below the signal line during downtrend
- Oscillator exiting overbought territory with trend filter negative
- Price showing weakness while oscillator moves from positive to negative
### For Exit Signals
- **Taking profits**: When oscillator approaches extreme levels in your trade direction
- **Stop-loss placement**: When oscillator crosses signal line against your position
- **Trend change warning**: When oscillator crosses zero line against your position
## Customization Options
### General Settings
- **Length**: (160)Controls the calculation period for the oscillator (higher values create smoother, less sensitive readings)
- **Source**: The price data input (close, open, high, low, hl2, hlc3, etc.)
### Signal Line Settings
- **Signal Line**: Optional smoothed version of the oscillator for crossover signals
- **Signal Length**:(36) Determines signal line responsiveness
### Level Settings
- **Overbought/Oversold Levels**: Standard thresholds that define extreme conditions
### Trend Filter Settings
- **Trend Period**: Lookback period for trend direction calculation
- **Trend Source**: Price data used for trend determination
### Visual Settings
- **Show Background Color**: Toggles colored background based on oscillator readings
- **Background Transparency**: Controls the opacity of background coloring
## Trading Strategy Applications
### Trend-Following Approach
1. Enter in the direction of the prevailing trend when:
- Oscillator and trend filter align
- Oscillator crosses signal line in trend direction
- Price pulls back to neutral zone during strong trend
2. Exit when:
- Oscillator crosses signal line against position
- Trend filter changes direction
- Oscillator reaches extreme level in your trade direction
### Counter-Trend Approach
1. Look for reversal opportunities when:
- Oscillator reaches extreme overbought/oversold levels
- Signal line crossover occurs at extreme readings
- Price action confirms potential reversal
2. Exit when:
- Target price levels are reached
- Oscillator returns to neutral zone
- New signals emerge in opposite direction
## Indicator Strengths
- Combines momentum and trend analysis in one comprehensive tool
- Consistent reference levels provide reliable benchmarks
- Reduces false signals through trend filter confirmation
- Visual color-coding provides intuitive market context
## Best Practices
- Effective on all timeframes for trend analysis
- Use in conjunction with support/resistance or price action
- Start with default settings and gradually adjust to your trading style and instrument
- Consider the overall market context when interpreting signals
The Trend Oscillator offers traders a comprehensive technical analysis framework that goes beyond simplistic overbought/oversold readings by incorporating trend context and normalized deviation methodology—providing a nuanced approach to market analysis with clear, consistent reference points.
Script su invito
Solo gli utenti approvati dall'autore possono accedere a questo script. È necessario richiedere e ottenere l'autorizzazione per utilizzarlo. Tale autorizzazione viene solitamente concessa dopo il pagamento. Per ulteriori dettagli, seguire le istruzioni dell'autore riportate di seguito o contattare direttamente SanttoshPDani.
TradingView NON consiglia di acquistare o utilizzare uno script a meno che non si abbia piena fiducia nel suo autore e se ne comprenda il funzionamento. È inoltre possibile trovare alternative gratuite e open source nei nostri script della community.
Istruzioni dell'autore
Declinazione di responsabilità
Script su invito
Solo gli utenti approvati dall'autore possono accedere a questo script. È necessario richiedere e ottenere l'autorizzazione per utilizzarlo. Tale autorizzazione viene solitamente concessa dopo il pagamento. Per ulteriori dettagli, seguire le istruzioni dell'autore riportate di seguito o contattare direttamente SanttoshPDani.
TradingView NON consiglia di acquistare o utilizzare uno script a meno che non si abbia piena fiducia nel suo autore e se ne comprenda il funzionamento. È inoltre possibile trovare alternative gratuite e open source nei nostri script della community.