OPEN-SOURCE SCRIPT
Aggiornato Candle Percentage Change
ndicator Setup: The script creates an indicator that overlays on the price chart.
Percentage Calculation: It calculates the percentage change between the current and previous candle closes.
Percentage Calculation: It calculates the percentage change between the current and previous candle closes.
Note di rilascio
Key Features:Percentage Change Calculation:
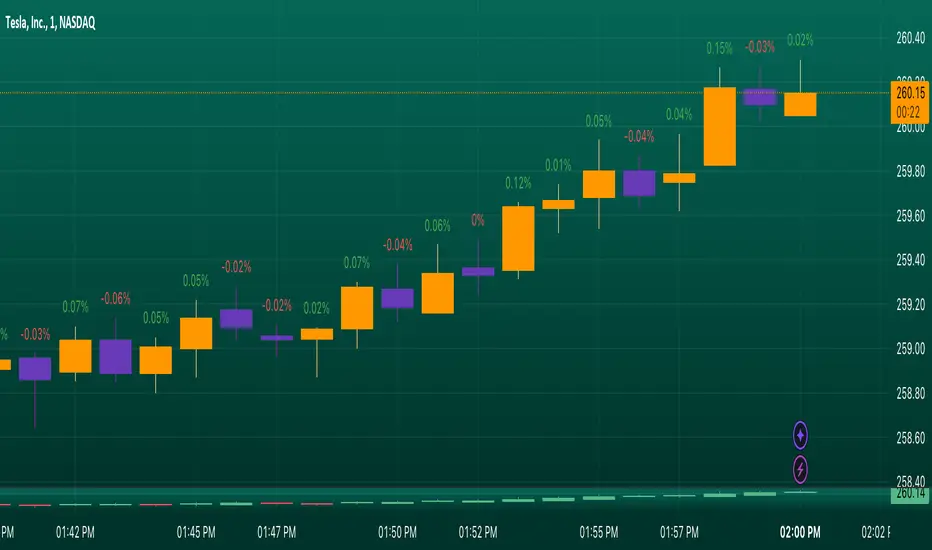
The script calculates the percentage change between the closing price of the current candle and the previous candle.
The text color of the percentage change is determined based on the direction of the candle:
Green for bullish candles (close > open).
Red for bearish candles (close < open).
Label Positioning:
The percentage change label is positioned slightly above the high of each candle to ensure visibility and avoid overlap with the candle body.
The label uses the syminfo.mintick variable to maintain appropriate spacing based on the instrument's tick size.
Label Creation:
A new label is created for each candle, displaying the calculated percentage change as text.
The label has a transparent background for a cleaner appearance on the chart.
Usage:
This indicator can be added to any price chart in TradingView. It allows traders to assess price movements quickly, identify trends, and make informed trading decisions based on recent price changes.
Example of Use:
A trader looking at a candlestick chart can easily spot how much the price has changed between each candle. For instance, a label showing "+2.35%" indicates a 2.35% increase from the previous close, while "-1.20%" indicates a 1.20% decrease.
This script is particularly useful for day traders, swing traders, and anyone interested in analyzing price action with a clear visual representation of percentage changes in the market.
Note di rilascio
Indicator Setup: The script creates an indicator that overlays on the price chart.Percentage Calculation: It calculates the percentage change between the current and previous candle closes.
Key Features:
Percentage Change Calculation:
The script calculates the percentage change between the closing price of the current candle and the previous candle.
The text color of the percentage change is determined based on the direction of the candle:
Green for bullish candles (close > open).
Red for bearish candles (close < open).
Usage:
This indicator can be added to any price chart in TradingView. It allows traders to assess price movements quickly, identify trends, and make informed trading decisions based on recent price changes.
Example of Use:
A trader looking at a candlestick chart can easily spot how much the price has changed between each candle. For instance, a label showing "+2.35%" indicates a 2.35% increase from the previous close, while "-1.20%" indicates a 1.20% decrease.
This script is particularly useful for day traders, swing traders, and anyone interested in analyzing price action with a clear visual representation of percentage changes in the market.
Note di rilascio
Label overlapping issues fixed.Note di rilascio
Label position fixedScript open-source
Nello spirito di TradingView, l'autore di questo script lo ha reso open source, in modo che i trader possano esaminarne e verificarne la funzionalità. Complimenti all'autore! Sebbene sia possibile utilizzarlo gratuitamente, ricordiamo che la ripubblicazione del codice è soggetta al nostro Regolamento.
Declinazione di responsabilità
Le informazioni e le pubblicazioni non sono intese come, e non costituiscono, consulenza o raccomandazioni finanziarie, di investimento, di trading o di altro tipo fornite o approvate da TradingView. Per ulteriori informazioni, consultare i Termini di utilizzo.
Script open-source
Nello spirito di TradingView, l'autore di questo script lo ha reso open source, in modo che i trader possano esaminarne e verificarne la funzionalità. Complimenti all'autore! Sebbene sia possibile utilizzarlo gratuitamente, ricordiamo che la ripubblicazione del codice è soggetta al nostro Regolamento.
Declinazione di responsabilità
Le informazioni e le pubblicazioni non sono intese come, e non costituiscono, consulenza o raccomandazioni finanziarie, di investimento, di trading o di altro tipo fornite o approvate da TradingView. Per ulteriori informazioni, consultare i Termini di utilizzo.