OPEN-SOURCE SCRIPT
Anchored Bollinger Band Range [SS]
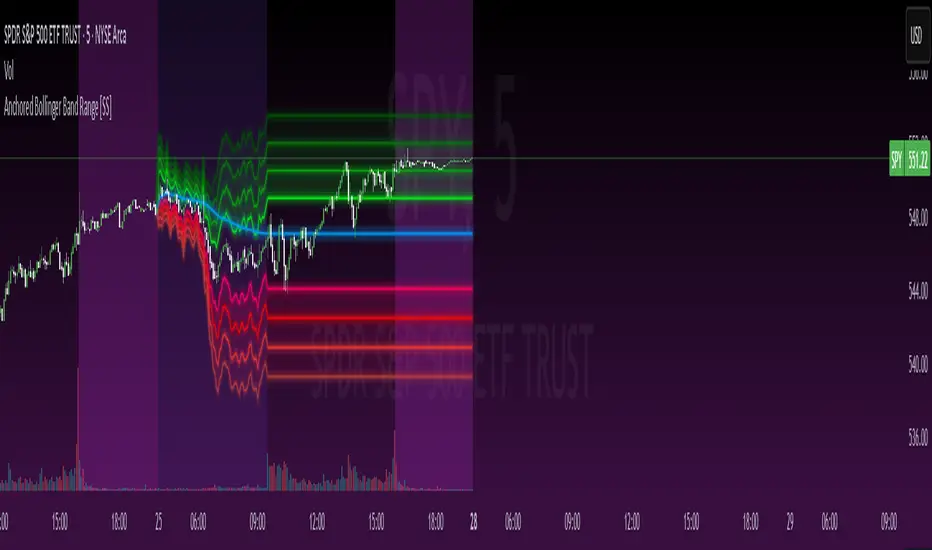
This is the anchored Bollinger band indicator.
What it does?
The anchored BB indicator:
How can you use it?
The anchored BB indicator has many applicable uses, including
The Opening Breakout Average
As you saw in the examples above, the blue line represents the opening breakout range average.
This is the average high of the period of interest and the average low of the period of interest.
Price action above this line would be considered Bullish, and Bearish if below.
This also acts as a retracement zone in non-trending markets. For example:

Best Use Cases
Worst Use Cases
User Inputs
The indicator is really straight forward. There are 2 optional inputs and 1 required input.
And that is the indicator! Very easy to use and hope you enjoy and find it helpful!
As always, safe trades everyone! 🚀
What it does?
The anchored BB indicator:
- Takes a user defined range and calculates the Standard Deviation of the entire selected range for the high and low values.
- Computes a moving average of the high and low during the selected period (which later becomes the breakout range average)
- Anchors to the last high and last low of the period range to add up to 4 standard deviations to the upside and downside, giving you 4 high and low targets.
How can you use it?
The anchored BB indicator has many applicable uses, including
- Identifying daily ranges based on premarket trading activity (see below):
- Finding breakout ranges for intraday pattern setups (see below):
Identified pattern of interest:
Applying Anchored BB: - Identifying daily or pattern biases based on the position to the opening breakout range average (blue line). See the examples with explanations:
ex#1:
ex#2:
The Opening Breakout Average
As you saw in the examples above, the blue line represents the opening breakout range average.
This is the average high of the period of interest and the average low of the period of interest.
Price action above this line would be considered Bullish, and Bearish if below.
This also acts as a retracement zone in non-trending markets. For example:
Best Use Cases
- Identify breakout ranges for patterns on larger timeframes. For example
This pattern on SPY, if we overlay the Anchored BB:
You want to see it actually breakout from this range and hold to confirm a breakout. Failure to exceed the BB range, means that it is just ranging with no real breakout momentum. - Identify conservative ranges for a specific period in time, for example QQQ:
Worst Use Cases
- Using it as a hard and fast support and resistance indicator. This is not what it is for and ranges can be exceeded with momentum. The key is looking for whether ranges are exceeded (i.e. high momentum, thus breakout play) or they are not (thus low volume, rangy).
- Using it for longer term outlooks. This is not ideal for long term ranges, as with any Bollinger/standard deviation based approach, it is only responsive to CURRENT PA and cannot forecast FUTURE PA.
User Inputs
The indicator is really straight forward. There are 2 optional inputs and 1 required input.
- Period Selection: Required. Selects the period for the indicator to perform the analysis on. You just select it with your mouse on the chart.
- Visible MA: Optional. You can choose to have the breakout range moving average visible or not.
- Fills: Optional. You can choose to have the fills plotted or not.
And that is the indicator! Very easy to use and hope you enjoy and find it helpful!
As always, safe trades everyone! 🚀
Script open-source
Nello spirito di TradingView, l'autore di questo script lo ha reso open source, in modo che i trader possano esaminarne e verificarne la funzionalità. Complimenti all'autore! Sebbene sia possibile utilizzarlo gratuitamente, ricordiamo che la ripubblicazione del codice è soggetta al nostro Regolamento.
Get:
- Live Updates,
- Discord access,
- Access to my Proprietary Merlin Software,
- Access to premium indicators,
patreon.com/steversteves
Now on X!
- Live Updates,
- Discord access,
- Access to my Proprietary Merlin Software,
- Access to premium indicators,
patreon.com/steversteves
Now on X!
Declinazione di responsabilità
Le informazioni e le pubblicazioni non sono intese come, e non costituiscono, consulenza o raccomandazioni finanziarie, di investimento, di trading o di altro tipo fornite o approvate da TradingView. Per ulteriori informazioni, consultare i Termini di utilizzo.