OPEN-SOURCE SCRIPT
Arrows Indicator
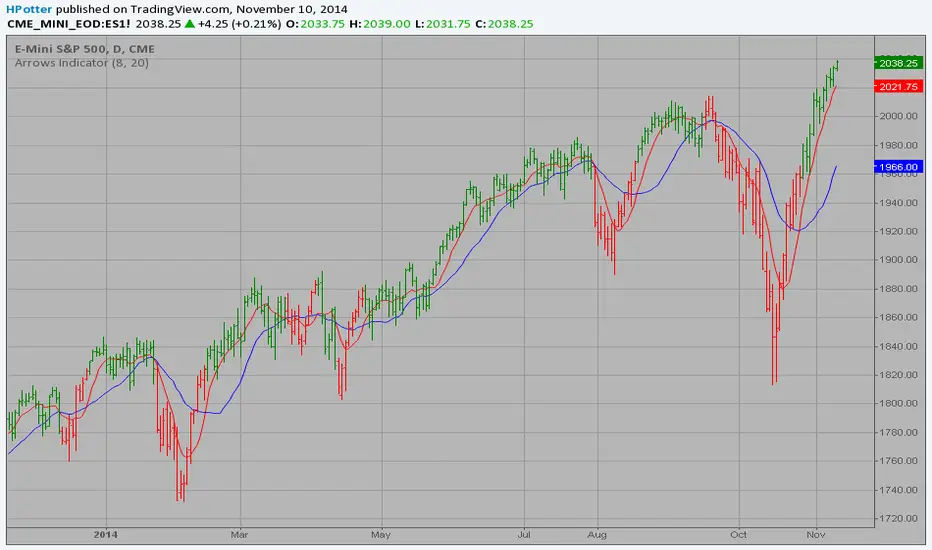
Green bars when 8 ema crosses above the 20 ema.
Red bars when 8 ema crosses below the 20 ema.
These studies are based on the March 2009 article, Second Chance
Options , by Barbara Star PhD.
Red bars when 8 ema crosses below the 20 ema.
These studies are based on the March 2009 article, Second Chance
Options , by Barbara Star PhD.
Script open-source
In pieno spirito TradingView, il creatore di questo script lo ha reso open-source, in modo che i trader possano esaminarlo e verificarne la funzionalità. Complimenti all'autore! Sebbene sia possibile utilizzarlo gratuitamente, ricorda che la ripubblicazione del codice è soggetta al nostro Regolamento.
Declinazione di responsabilità
Le informazioni ed i contenuti pubblicati non costituiscono in alcun modo una sollecitazione ad investire o ad operare nei mercati finanziari. Non sono inoltre fornite o supportate da TradingView. Maggiori dettagli nelle Condizioni d'uso.