OPEN-SOURCE SCRIPT
Kay_BBands
All right people... !!
Here is one more crazy stupid experiment by me while boosing. I call it..... Well Bollinger Bands for now..
If you like it and find it useful, give me suggestions, we can name it.
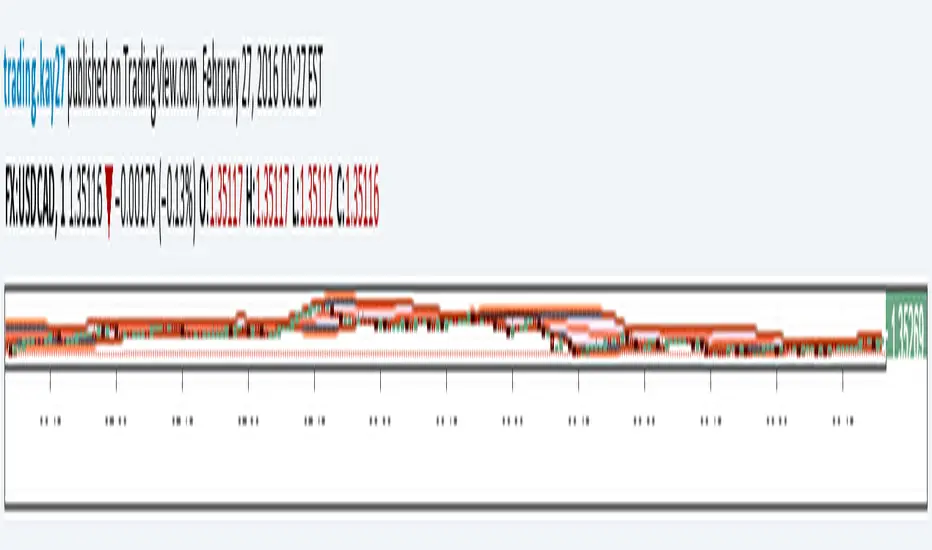
Its was just an idea of removing unnecessary opposite bands (noise i say) and it turned out to be useful to me.
After finishing, I saw good locations of support and resistance levels building.
Just connect the flat lines it create.
See if that interests you...!! Please leave comments below even if you are not in mood.
Thanks..
Here is one more crazy stupid experiment by me while boosing. I call it..... Well Bollinger Bands for now..
If you like it and find it useful, give me suggestions, we can name it.
Its was just an idea of removing unnecessary opposite bands (noise i say) and it turned out to be useful to me.
After finishing, I saw good locations of support and resistance levels building.
Just connect the flat lines it create.
See if that interests you...!! Please leave comments below even if you are not in mood.
Thanks..
Script open-source
In pieno spirito TradingView, il creatore di questo script lo ha reso open-source, in modo che i trader possano esaminarlo e verificarne la funzionalità. Complimenti all'autore! Sebbene sia possibile utilizzarlo gratuitamente, ricorda che la ripubblicazione del codice è soggetta al nostro Regolamento.
Declinazione di responsabilità
Le informazioni ed i contenuti pubblicati non costituiscono in alcun modo una sollecitazione ad investire o ad operare nei mercati finanziari. Non sono inoltre fornite o supportate da TradingView. Maggiori dettagli nelle Condizioni d'uso.