OPEN-SOURCE SCRIPT
Table: Colorable Timeframes Top-Down Analysis
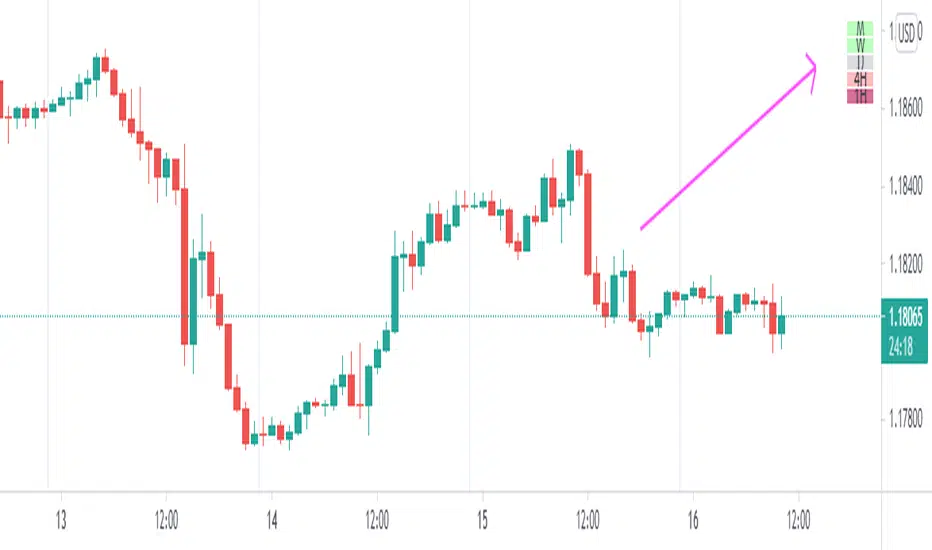
This is a very simple indicator that lets you color up to five different cells. After doing Top-Down analysis, you are probably going to stay on the lowest of timeframes, and if you work with many tickers, you may forget the bigger picture or confuse them.
So you can make some timeframes green if they are bullish or red if they are bearish and you will always have a reminder on the screen in the form of this small non-intrusive table.
So you can make some timeframes green if they are bullish or red if they are bearish and you will always have a reminder on the screen in the form of this small non-intrusive table.
Script open-source
Nello spirito di TradingView, l'autore di questo script lo ha reso open source, in modo che i trader possano esaminarne e verificarne la funzionalità. Complimenti all'autore! Sebbene sia possibile utilizzarlo gratuitamente, ricordiamo che la ripubblicazione del codice è soggetta al nostro Regolamento.
Declinazione di responsabilità
Le informazioni e le pubblicazioni non sono intese come, e non costituiscono, consulenza o raccomandazioni finanziarie, di investimento, di trading o di altro tipo fornite o approvate da TradingView. Per ulteriori informazioni, consultare i Termini di utilizzo.