OPEN-SOURCE SCRIPT
UCS_Squeeze_Timing-V1
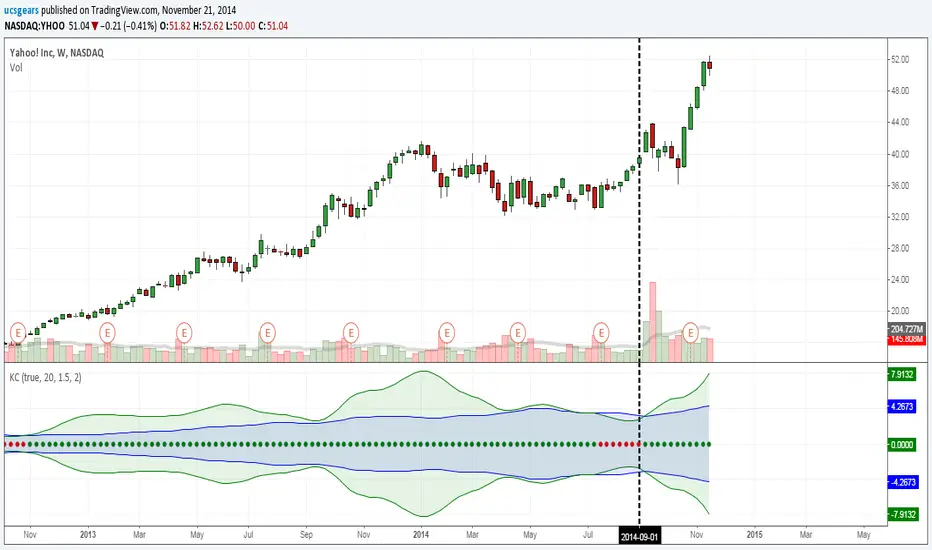
There is an important information the Squeeze indicator is missing, which is the Pre Squeeze entry. While the Bollinger band begins to curves out of the KC, The breakout usually happens. There are many instances that the Squeeze indicator will fire, after the Major move, I cant blame the indicator, thats the nature (lagging) of all indicators, and we have to live with it.
Therefore pre-squeeze-fire Entry can be critical in timing your entry. Timing it too early could result in stoploss if it turns against you, ( or serious burn on options premium), because we never know when the squeeze will fire with the TTM squeeze, But now We know. Its a little timing tool. Managing position is critical when playing options.
I will code the timing signal when I get some time.
Updated Versions - tradingview.com/v/2y0I0MRm/
Script open-source
In pieno spirito TradingView, il creatore di questo script lo ha reso open-source, in modo che i trader possano esaminarlo e verificarne la funzionalità. Complimenti all'autore! Sebbene sia possibile utilizzarlo gratuitamente, ricorda che la ripubblicazione del codice è soggetta al nostro Regolamento.
Uday C Santhakumar
Declinazione di responsabilità
Le informazioni ed i contenuti pubblicati non costituiscono in alcun modo una sollecitazione ad investire o ad operare nei mercati finanziari. Non sono inoltre fornite o supportate da TradingView. Maggiori dettagli nelle Condizioni d'uso.