OPEN-SOURCE SCRIPT
Olegorov: Volume + EMA

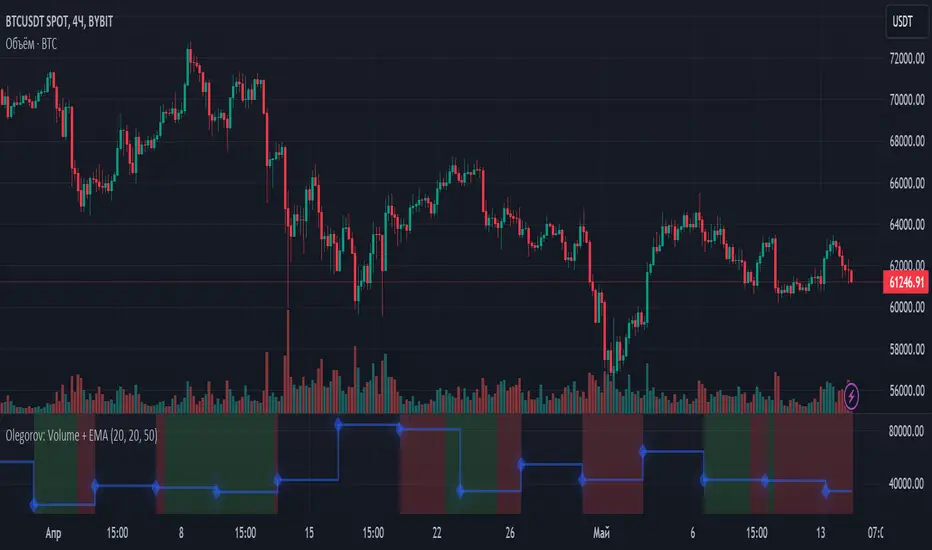
This script creates an indicator that displays the volume of each interval along with two Exponential Moving Averages (EMAs). Here's how the code works:
Interval Length and EMA Lengths: Users can specify the length of each interval in candles and the lengths of two EMAs (EMA 1 and EMA 2) using input parameters.
Calculating EMAs: The script calculates two EMAs (ema1 and ema2) based on the closing prices of the candles. The lengths of these EMAs are determined by the user inputs.
Calculating Interval Volume: The calcIntervalVolume() function calculates the total volume for the current interval by summing up the volume of the past intervalLength candles.
Plotting Volume: The script plots the total volume of the current interval on the chart using plot(). The volume is displayed as an area plot with the specified color and transparency.
Comparing Current and Previous Intervals: The script compares the total volume of the current interval with that of the previous interval. If the current interval's volume is less than the previous interval's volume, it sets a boolean variable isCurrentLessThanPrevious to true; otherwise, it sets it to false.
Comparing EMAs: It compares the values of ema1 and ema2. If ema1 is greater than ema2, it sets the boolean variable isEMA1GreaterThanEMA2 to true; otherwise, it sets it to false.
Coloring the Background: Based on the comparison results, the script colors the background of the chart. If the current interval's volume is less than the previous interval's volume and ema1 is greater than ema2, it colors the background green. If the current interval's volume is less than the previous interval's volume and ema1 is less than ema2, it colors the background red. Otherwise, it colors the background gray.
This indicator can be useful for identifying periods of high and low volume relative to the previous interval, along with the relationship between two EMAs. It can be used in various trading strategies, such as trend following or momentum trading, where volume and moving averages play important roles in decision-making. For example, traders might look for bullish signals when the current interval's volume is higher than the previous interval's volume and ema1 is above ema2, indicating potential upward momentum. Conversely, bearish signals might be considered when the current interval's volume is lower than the previous interval's volume and ema1 is below ema2, suggesting potential downward momentum.
Script open-source
Nello spirito di TradingView, l'autore di questo script lo ha reso open source, in modo che i trader possano esaminarne e verificarne la funzionalità. Complimenti all'autore! Sebbene sia possibile utilizzarlo gratuitamente, ricordiamo che la ripubblicazione del codice è soggetta al nostro Regolamento.
Declinazione di responsabilità
Le informazioni e le pubblicazioni non sono intese come, e non costituiscono, consulenza o raccomandazioni finanziarie, di investimento, di trading o di altro tipo fornite o approvate da TradingView. Per ulteriori informazioni, consultare i Termini di utilizzo.