OPEN-SOURCE SCRIPT
Doji Followed by Bullish or Bearish Candle

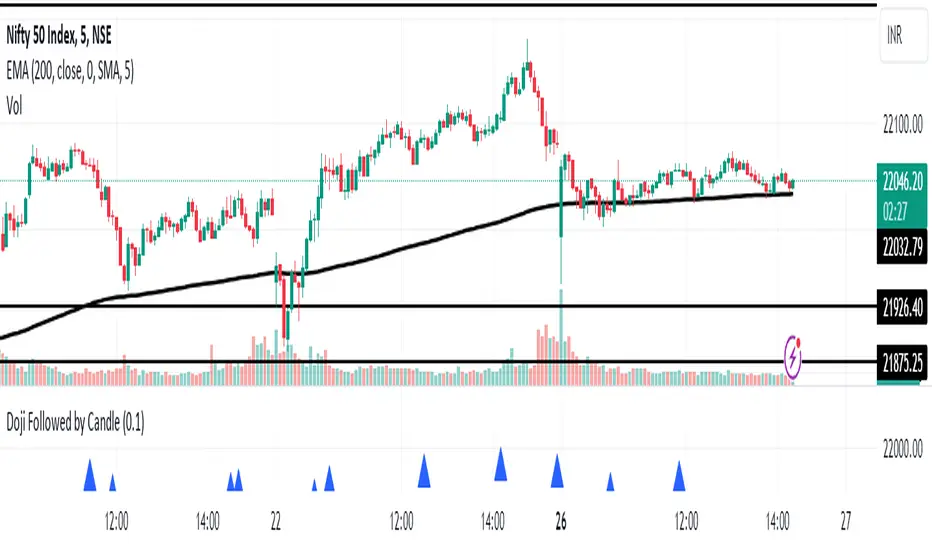
This indicator identifies instances where a doji candlestick pattern is followed by either a bullish or bearish candle, indicating potential reversal or continuation signals in the market.
Features:
Doji Detection: Utilizes the concept of doji candlesticks, where the difference between the open and close prices is minimal compared to the candle's overall range.
Candlestick Identification: Determines whether the following candle is bullish (close > open) or bearish (close < open).
Customizable Threshold: Allows users to adjust the sensitivity of the doji detection by modifying the doji body factor parameter.
Alerts: Generates alerts when a doji candle is followed by a bullish or bearish candle, signaling potential trading opportunities.
How to Use:
When a blue triangle appears below a candle, it indicates that a doji candle was followed by a bullish or bearish candle.
Traders can interpret these signals as potential entry or exit points in their trading strategies.
Note: This indicator should be used in conjunction with other technical analysis tools and indicators for comprehensive market analysis.
Script open-source
Nello spirito di TradingView, l'autore di questo script lo ha reso open source, in modo che i trader possano esaminarne e verificarne la funzionalità. Complimenti all'autore! Sebbene sia possibile utilizzarlo gratuitamente, ricordiamo che la ripubblicazione del codice è soggetta al nostro Regolamento.
Declinazione di responsabilità
Le informazioni e le pubblicazioni non sono intese come, e non costituiscono, consulenza o raccomandazioni finanziarie, di investimento, di trading o di altro tipo fornite o approvate da TradingView. Per ulteriori informazioni, consultare i Termini di utilizzo.