OPEN-SOURCE SCRIPT
SMA Trend Spectrum [InvestorUnknown]
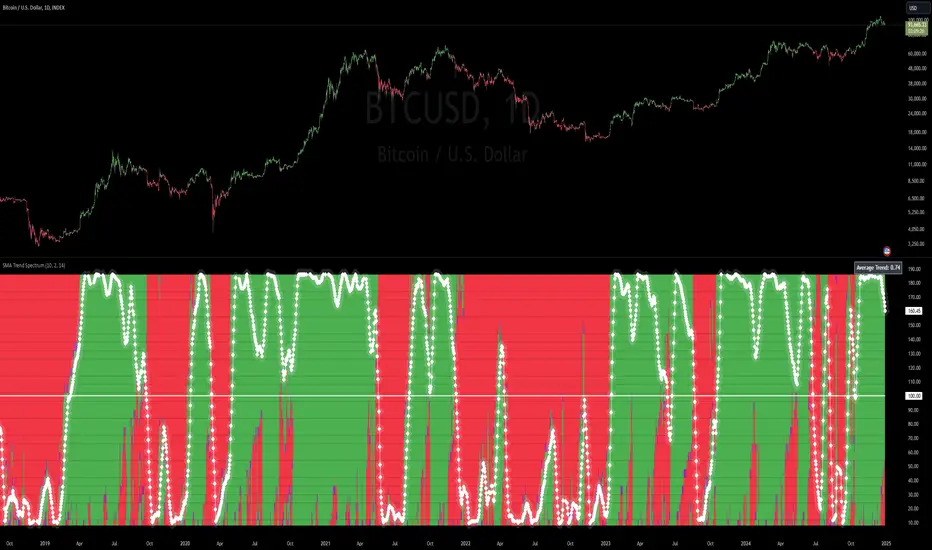
The SMA Trend Spectrum indicator is designed to visually represent market trends and momentum by using a series of Simple Moving Averages (SMAs) to create a color-coded spectrum or heatmap. This tool helps traders identify the strength and direction of market trends across various time frames within one chart.
Functionality:

Pine Script®


Additional Features:
Usage:
Notes:
Disclaimer: Past performance does not guarantee future results. Always use this indicator as part of a broader trading strategy.
Functionality:
- SMA Calculation: The indicator calculates multiple SMAs starting from a user-defined base period (Starting Period) and increasing by a specified increment (Period Increment). This creates a sequence of moving averages that span from short-term to long-term perspectives.
- Trend Analysis: Each segment of the spectrum compares three SMAs to determine the market's trend strength: Bullish (color-coded green) when the current price is above all three SMAs. Neutral (color-coded purple) when the price is above some but not all SMAs. Bearish (color-coded red) when the price is below all three SMAs.
f_col(x1, x2, x3) =>
min = ta.sma(src, x1)
mid = ta.sma(src, x2)
max = ta.sma(src, x3)
c = src > min and src > mid and src > max ? bull : src > min or src > mid or src > max ? ncol : bear
- Heatmap Visualization: The indicator plots these trends as a vertical spectrum where each row represents a different set of SMAs, forming a heatmap-like display. The color of each segment in the heatmap directly correlates with market conditions, providing an intuitive view of market sentiment.
- Signal Smoothing: Users can choose to smooth the trend signal using either a Simple Moving Average (SMA), Exponential Moving Average (EMA), or leave it as raw data (Signal Smoothing). The length of smoothing can be adjusted (Smoothing Length). The signal is displayed in a scaled way to automatically adjust for the best visual experience, ensuring that the trend is clear and easily interpretable across different chart scales and time frames
Additional Features:
- Plot Signal: Optionally plots a line representing the average trend across all calculated SMAs. This line helps in identifying the overall market direction based on the spectrum data.
- Bar Coloring: Bars on the chart can be colored according to the average trend strength, providing a quick visual cue of market conditions.
Usage:
- Trend Identification: Use the heatmap to quickly assess if the market is trending strongly in one direction or if it's in a consolidation phase.
- Entry/Exit Points: Look for shifts in color patterns to anticipate potential trend changes or confirmations for entry or exit points.
- Momentum Analysis: The gradient from bearish to bullish across the spectrum can be used to gauge momentum and potentially forecast future price movements.
Notes:
- The effectiveness of this indicator can vary based on market conditions, asset volatility, and the chosen SMA periods and increments.
- It's advisable to combine this tool with other technical indicators or fundamental analysis for more robust trading decisions.
Disclaimer: Past performance does not guarantee future results. Always use this indicator as part of a broader trading strategy.
Script open-source
Nello spirito di TradingView, l'autore di questo script lo ha reso open source, in modo che i trader possano esaminarne e verificarne la funzionalità. Complimenti all'autore! Sebbene sia possibile utilizzarlo gratuitamente, ricordiamo che la ripubblicazione del codice è soggetta al nostro Regolamento.
Declinazione di responsabilità
Le informazioni e le pubblicazioni non sono intese come, e non costituiscono, consulenza o raccomandazioni finanziarie, di investimento, di trading o di altro tipo fornite o approvate da TradingView. Per ulteriori informazioni, consultare i Termini di utilizzo.