OPEN-SOURCE SCRIPT
ATH Levels v4
# ATH Levels v4
A powerful indicator for tracking All-Time Highs (ATH) and setting customizable price levels based on percentage drops from the ATH. Perfect for cryptocurrency trading, DCA strategies, and risk management.
## Overview
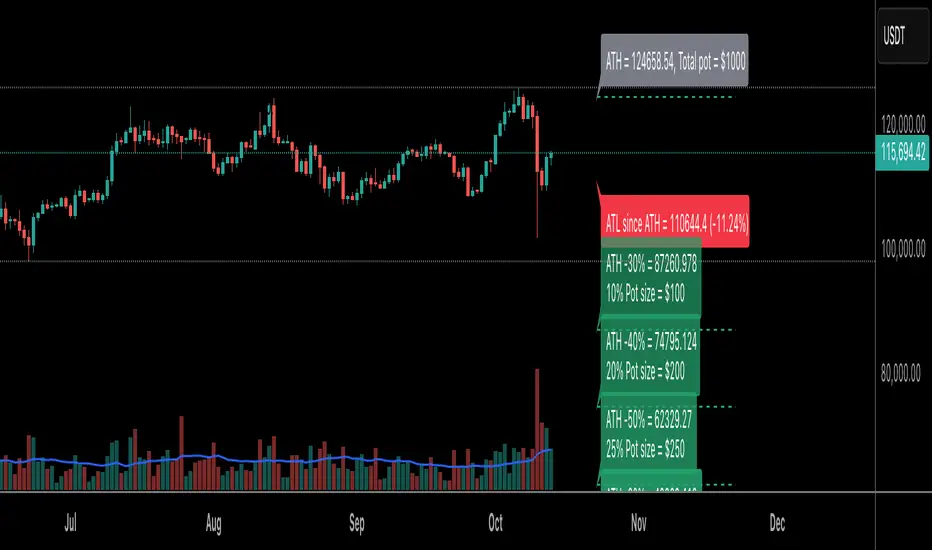
ATH Levels v4 helps traders visualize key support levels calculated as percentage drops from the All-Time High within a configurable lookback period. The indicator also tracks the All-Time Low (ATL) since the last ATH, providing a complete picture of price range dynamics.
## Key Features
### Configurable Percentage Levels
- Define up to 8 custom price levels as percentage drops from ATH
- No longer limited to fixed 10% intervals
- Each level can be set anywhere from 0% to 100% drop
- Default levels: 10%, 20%, 30%, 40%, 50%, 60%, 70%, 80%
### ATL Tracking (NEW in v4)
- Automatically tracks the All-Time Low since the last ATH was reached
- Displays ATL price and percentage drop from ATH
- Resets when a new ATH is detected
- Can be toggled on/off
### Portfolio Management
- Allocate pot size percentages to each level
- Visualize dollar amounts for each level based on your total pot size
- Plan your DCA (Dollar Cost Averaging) strategy
- Only displays levels with allocated pot percentages
### Flexible Display Options
- Show/hide level lines
- Hide ATH level for zooming into lower levels
- Configurable lookback period (default 365 days)
- Adjustable right margin positioning for labels
- Color-coded labels with transparency gradient
## How to Use
### Basic Setup
1. Add the indicator to your chart
2. Set your total pot size in dollars
3. Configure the percentage drops for each level (where you want to buy/accumulate)
4. Allocate pot size percentages to each level
### Example DCA Strategy
```
Total Pot Size: $10,000
Level 3 (-30%): 10% pot = $1,000
Level 4 (-40%): 20% pot = $2,000
Level 5 (-50%): 25% pot = $2,500
Level 6 (-60%): 30% pot = $3,000
Level 7 (-70%): 10% pot = $1,000
Level 8 (-80%): 5% pot = $500
```
## Settings
### Display Options
- **Show level lines**: Toggle horizontal lines on/off
- **Hide ATH level**: Hide the ATH label for cleaner charts
- **Show ATL since last ATH**: Display/hide the All-Time Low indicator
- **Days to Lookback**: Period for calculating ATH (default: 365)
- **Margin from last bar**: Spacing between chart and labels (default: 10)
### Level Configuration
- **Level 1-8 % drop from ATH**: Set custom percentage drops (0-100%)
- **Level 1-8 pot %**: Allocate your portfolio percentage to each level (0-100%)
**Note**: Levels only display if they have a pot percentage allocated (>0%)
### Pot Size
- **Pot size**: Total amount in dollars available for the strategy
## Version History
### V4 (October 2025)
- Upgraded to PineScript v6
- Configurable percentage drops from ATH (no longer hardcoded)
- ATL tracking and display since last ATH
- Updated syntax and functions for v6 compatibility
### V3 (May 2020)
- Added option to hide ATH level for better chart zoom
### V2
- Hide/show level lines
- Configurable lookback period
- Configurable right margin
- Only shows levels with pot size % set
### V1
- Initial release with 8 fixed levels
## Use Cases
### Cryptocurrency Trading
- Plan accumulation zones during bear markets
- Set alerts at key percentage drops from ATH
- Track historical ATH and ATL ranges
### Risk Management
- Visualize potential support zones
- Plan position sizing at different levels
- Monitor distance from ATH in real-time
### DCA Strategies
- Automate dollar-cost averaging planning
- Allocate budget across multiple price levels
- Track execution of your DCA plan
## Technical Details
- **Version**: PineScript v6
- **Type**: Indicator
- **Overlay**: Yes
- **Default Timeframe**: Works on all timeframes
- **Calculations**: Based on closing prices within lookback period
## Credits
Original concept inspired by daytask. Enhanced and maintained by SilvesterScorpion.com
## License
This source code is subject to the terms of the Mozilla Public License 2.0 at mozilla.org/MPL/2.0/
---
**Tip**: For best results, use on higher timeframes (4H, Daily, Weekly) to identify major support zones. Combine with volume analysis and other indicators for confirmation.
A powerful indicator for tracking All-Time Highs (ATH) and setting customizable price levels based on percentage drops from the ATH. Perfect for cryptocurrency trading, DCA strategies, and risk management.
## Overview
ATH Levels v4 helps traders visualize key support levels calculated as percentage drops from the All-Time High within a configurable lookback period. The indicator also tracks the All-Time Low (ATL) since the last ATH, providing a complete picture of price range dynamics.
## Key Features
### Configurable Percentage Levels
- Define up to 8 custom price levels as percentage drops from ATH
- No longer limited to fixed 10% intervals
- Each level can be set anywhere from 0% to 100% drop
- Default levels: 10%, 20%, 30%, 40%, 50%, 60%, 70%, 80%
### ATL Tracking (NEW in v4)
- Automatically tracks the All-Time Low since the last ATH was reached
- Displays ATL price and percentage drop from ATH
- Resets when a new ATH is detected
- Can be toggled on/off
### Portfolio Management
- Allocate pot size percentages to each level
- Visualize dollar amounts for each level based on your total pot size
- Plan your DCA (Dollar Cost Averaging) strategy
- Only displays levels with allocated pot percentages
### Flexible Display Options
- Show/hide level lines
- Hide ATH level for zooming into lower levels
- Configurable lookback period (default 365 days)
- Adjustable right margin positioning for labels
- Color-coded labels with transparency gradient
## How to Use
### Basic Setup
1. Add the indicator to your chart
2. Set your total pot size in dollars
3. Configure the percentage drops for each level (where you want to buy/accumulate)
4. Allocate pot size percentages to each level
### Example DCA Strategy
```
Total Pot Size: $10,000
Level 3 (-30%): 10% pot = $1,000
Level 4 (-40%): 20% pot = $2,000
Level 5 (-50%): 25% pot = $2,500
Level 6 (-60%): 30% pot = $3,000
Level 7 (-70%): 10% pot = $1,000
Level 8 (-80%): 5% pot = $500
```
## Settings
### Display Options
- **Show level lines**: Toggle horizontal lines on/off
- **Hide ATH level**: Hide the ATH label for cleaner charts
- **Show ATL since last ATH**: Display/hide the All-Time Low indicator
- **Days to Lookback**: Period for calculating ATH (default: 365)
- **Margin from last bar**: Spacing between chart and labels (default: 10)
### Level Configuration
- **Level 1-8 % drop from ATH**: Set custom percentage drops (0-100%)
- **Level 1-8 pot %**: Allocate your portfolio percentage to each level (0-100%)
**Note**: Levels only display if they have a pot percentage allocated (>0%)
### Pot Size
- **Pot size**: Total amount in dollars available for the strategy
## Version History
### V4 (October 2025)
- Upgraded to PineScript v6
- Configurable percentage drops from ATH (no longer hardcoded)
- ATL tracking and display since last ATH
- Updated syntax and functions for v6 compatibility
### V3 (May 2020)
- Added option to hide ATH level for better chart zoom
### V2
- Hide/show level lines
- Configurable lookback period
- Configurable right margin
- Only shows levels with pot size % set
### V1
- Initial release with 8 fixed levels
## Use Cases
### Cryptocurrency Trading
- Plan accumulation zones during bear markets
- Set alerts at key percentage drops from ATH
- Track historical ATH and ATL ranges
### Risk Management
- Visualize potential support zones
- Plan position sizing at different levels
- Monitor distance from ATH in real-time
### DCA Strategies
- Automate dollar-cost averaging planning
- Allocate budget across multiple price levels
- Track execution of your DCA plan
## Technical Details
- **Version**: PineScript v6
- **Type**: Indicator
- **Overlay**: Yes
- **Default Timeframe**: Works on all timeframes
- **Calculations**: Based on closing prices within lookback period
## Credits
Original concept inspired by daytask. Enhanced and maintained by SilvesterScorpion.com
## License
This source code is subject to the terms of the Mozilla Public License 2.0 at mozilla.org/MPL/2.0/
---
**Tip**: For best results, use on higher timeframes (4H, Daily, Weekly) to identify major support zones. Combine with volume analysis and other indicators for confirmation.
Script open-source
In pieno spirito TradingView, il creatore di questo script lo ha reso open-source, in modo che i trader possano esaminarlo e verificarne la funzionalità. Complimenti all'autore! Sebbene sia possibile utilizzarlo gratuitamente, ricorda che la ripubblicazione del codice è soggetta al nostro Regolamento.
Declinazione di responsabilità
Le informazioni ed i contenuti pubblicati non costituiscono in alcun modo una sollecitazione ad investire o ad operare nei mercati finanziari. Non sono inoltre fornite o supportate da TradingView. Maggiori dettagli nelle Condizioni d'uso.