OPEN-SOURCE SCRIPT
Fibonacci Bands
Description
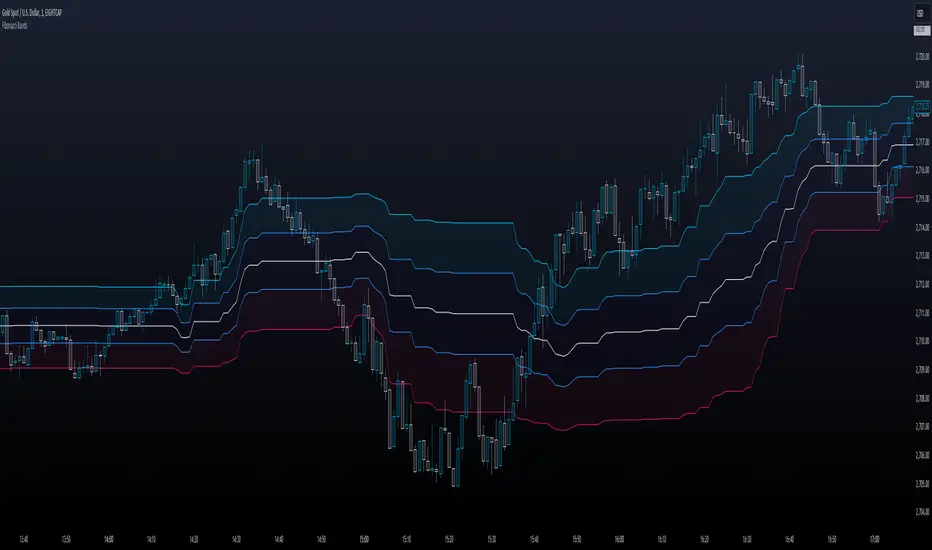
This indicator dynamically calculates Fibonacci retracement levels based on the highest high and lowest low over a specified lookback period. The key Fibonacci levels (0.236, 0.382, 0.5, 0.618, and 0.786) are plotted on the chart, with shaded areas between these levels for visual guidance.
How it works
Key Features
Unique Points
Fibonacci Focus: This script is specifically designed around Fibonacci retracement levels, which are popular among technical traders for identifying potential reversal points.
Dynamic Range Calculation: The use of the highest high and lowest low within a user-defined period offers a dynamic approach to adapting to changing market conditions.
How to use it
This indicator dynamically calculates Fibonacci retracement levels based on the highest high and lowest low over a specified lookback period. The key Fibonacci levels (0.236, 0.382, 0.5, 0.618, and 0.786) are plotted on the chart, with shaded areas between these levels for visual guidance.
How it works
- The script computes the highest high (hh) and the lowest low (ll) over the defined length.
- It calculates the price range (delta) as the difference between the highest high and the lowest low.
- Fibonacci levels are then determined using the formula: ℎℎ − (delta × Fibonacci ratio)
- Each Fibonacci level is then plotted as a line with a specific color.
Key Features
- Customizable Length: Users can adjust the lookback period to suit their trading strategy.
- Multiple Fibonacci Levels: Includes common Fibonacci retracement levels, providing traders with a comprehensive view of potential support and resistance areas.
- Visual Fillings: The script includes customizable shading between levels, which helps traders quickly identify key zones (like the "Golden Zone" between 0.5 and 0.618).
Unique Points
Fibonacci Focus: This script is specifically designed around Fibonacci retracement levels, which are popular among technical traders for identifying potential reversal points.
Dynamic Range Calculation: The use of the highest high and lowest low within a user-defined period offers a dynamic approach to adapting to changing market conditions.
How to use it
- Adjust the length parameter (default is 60) to determine how many bars back the indicator will calculate the highest high and lowest low. A longer length may provide a broader perspective of price action, while a shorter length may react more quickly to recent price changes.
- Observe the plotted Fibonacci levels: 0.236, 0.382, 0.5, 0.618, and 0.786. These levels often act as potential support and resistance points. Pay attention to how price interacts with these levels.
- When the price approaches a Fibonacci level, consider it a potential reversal point. The filled areas between the Fibonacci levels indicate zones where price might consolidate or reverse. The "Golden Zone" (between 0.5 and 0.618) is particularly significant; many traders watch this area closely for potential entry points in an uptrend or exit points in a downtrend.
Script open-source
Nello spirito di TradingView, l'autore di questo script lo ha reso open source, in modo che i trader possano esaminarne e verificarne la funzionalità. Complimenti all'autore! Sebbene sia possibile utilizzarlo gratuitamente, ricordiamo che la ripubblicazione del codice è soggetta al nostro Regolamento.
Declinazione di responsabilità
Le informazioni e le pubblicazioni non sono intese come, e non costituiscono, consulenza o raccomandazioni finanziarie, di investimento, di trading o di altro tipo fornite o approvate da TradingView. Per ulteriori informazioni, consultare i Termini di utilizzo.