OPEN-SOURCE SCRIPT
JADUGAAR_GORACHAND_V2
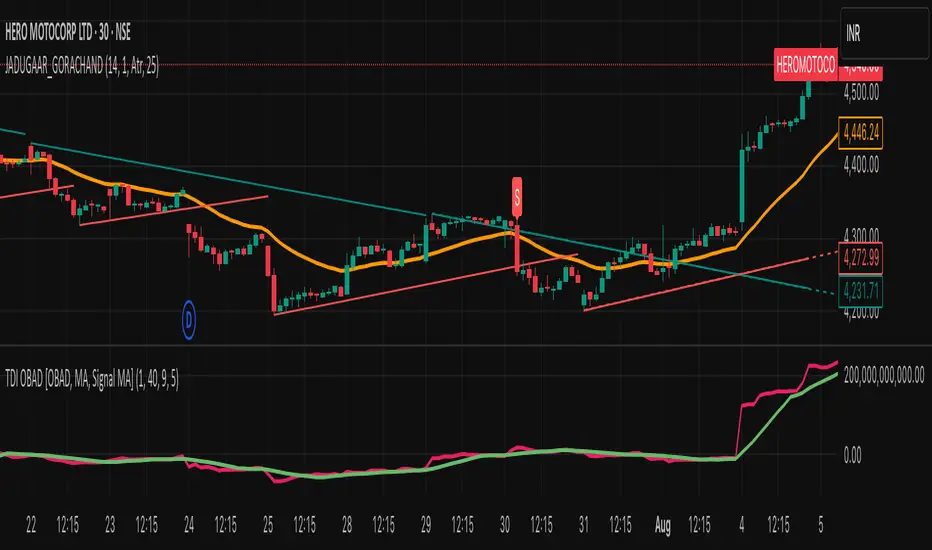
1. What is a Trendline?
A trendline is a straight line drawn on a chart that connects two or more price points. It helps visualize the direction and strength of a trend — uptrend, downtrend, or sideways.
🔼 2. Uptrend Line
An uptrend line connects higher lows. It acts as a support level, suggesting that buyers are in control. Price tends to bounce upward off this line during a bullish trend.
🔽 3. Downtrend Line
A downtrend line connects lower highs. It acts as a resistance level, indicating that sellers dominate. Price tends to fall after touching this line in a bearish trend.
🔄 4. Trendline Breaks
When price breaks a trendline, it may signal a potential trend reversal or trend weakening. Traders often use this for entry or exit signals.
📊 5. Trendline Validity
A trendline is more reliable when:
It touches 3 or more points
It's drawn over a longer time frame
There's strong volume on the breakout
Script open-source
Nello spirito di TradingView, l'autore di questo script lo ha reso open source, in modo che i trader possano esaminarne e verificarne la funzionalità. Complimenti all'autore! Sebbene sia possibile utilizzarlo gratuitamente, ricordiamo che la ripubblicazione del codice è soggetta al nostro Regolamento.
Declinazione di responsabilità
Le informazioni e le pubblicazioni non sono intese come, e non costituiscono, consulenza o raccomandazioni finanziarie, di investimento, di trading o di altro tipo fornite o approvate da TradingView. Per ulteriori informazioni, consultare i Termini di utilizzo.