PROTECTED SOURCE SCRIPT
EMA MAGIC BAND
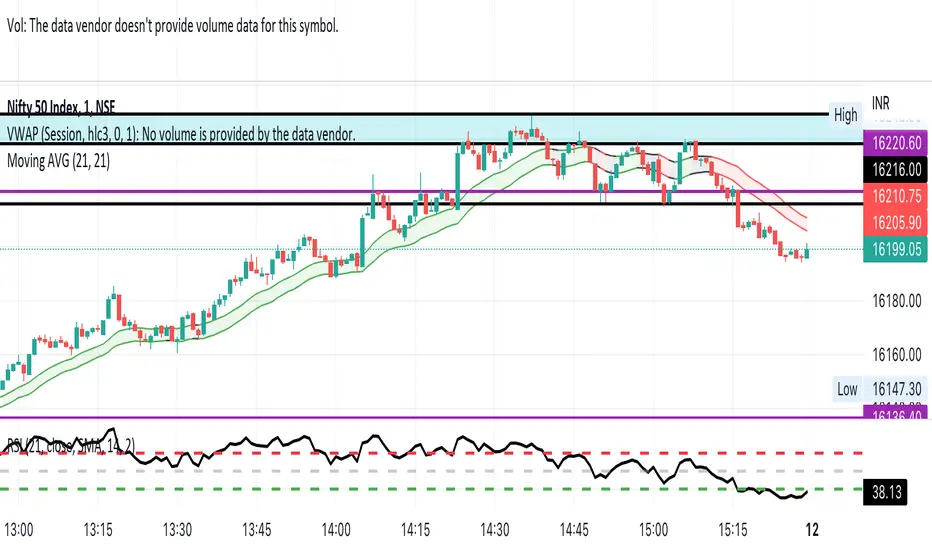
This is the 21 EMA Band Which follows the chart for the last 21 Average High and Low Prices of the Candle with Integrated RSI. This is a Colourful Band When Market is in Uptrend it shows Green, Market is Downtrend it shows Red and When Sideways Black.
Script protetto
Questo script è pubblicato come codice protetto. Tuttavia, è possibile utilizzarle liberamente e senza alcuna limitazione – ulteriori informazioni qui.
Declinazione di responsabilità
Le informazioni e le pubblicazioni non sono intese come, e non costituiscono, consulenza o raccomandazioni finanziarie, di investimento, di trading o di altro tipo fornite o approvate da TradingView. Per ulteriori informazioni, consultare i Termini di utilizzo.