OPEN-SOURCE SCRIPT
Linear Regression Intercept

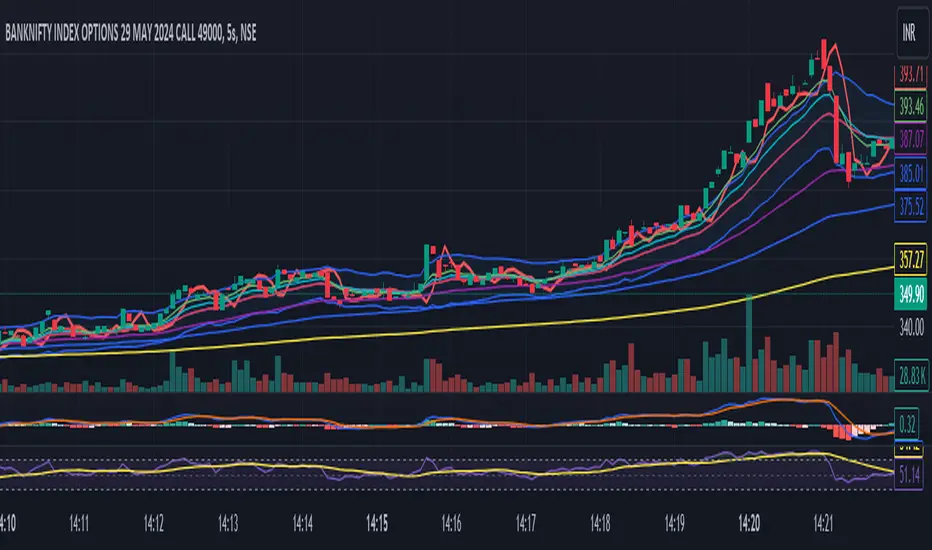
Linear Regression Intercept (LRI) is a statistical method used to forecast future values based on past data. Financial markets frequently employ it to identify the underlying trend and determine when prices are overextended. Linear regression utilizes the least squares method to create a trendline by minimizing the distance between observed price data and the line. The LRI indicator calculates the intercept of this trendline for each data point, providing insights into price trends and potential trading opportunities.
Calculation and Interpretation of the LRI
The linear regression intercept is calculated using the following formula:
LRI = Y - (b * X)
Where Y represents the dependent variable (price), b is the slope of the regression line, and X is the independent variable (time). To determine the slope b, you can use the formula:
b = Σ[(X - X_mean) * (Y - Y_mean)] / Σ(X - X_mean)^2
Once you have computed the LRI, it can be interpreted as the point at which the regression line intersects the Y-axis (price) when the independent variable (time) is zero. A positive LRI value indicates an upward trend, while a negative value suggests a downward trend. Traders can adjust the parameters of the LRI by modifying the period over which the linear regression is computed, which can impact the indicator’s sensitivity to recent price changes.
How to Use the LRI in Trading
To effectively use the LRI in trading, traders should consider the following:
Understanding the signals generated by the technical indicator: A rising LRI suggests an upward trend, whereas a falling LRI indicates a downward trend. Traders may use this information to help determine the market’s direction and identify reversals.
Combining the technical indicator with other indicators: The LRI can be used in conjunction with other technical indicators, such as moving averages, the Relative Strength Index (RSI), or traditional linear regression lines, to obtain a more comprehensive view of the market. In the case of traditional linear regression lines, the LRI helps traders identify the starting point of the trend, providing additional context to the overall trend direction.
Using the technical indicator for entry and exit signals: When the LRI crosses above or below a specific threshold, traders may consider it a potential entry or exit point. For example, if the LRI crosses above zero, it might signal a possible buying opportunity.
Script open-source
Nello spirito di TradingView, l'autore di questo script lo ha reso open source, in modo che i trader possano esaminarne e verificarne la funzionalità. Complimenti all'autore! Sebbene sia possibile utilizzarlo gratuitamente, ricordiamo che la ripubblicazione del codice è soggetta al nostro Regolamento.
Declinazione di responsabilità
Le informazioni e le pubblicazioni non sono intese come, e non costituiscono, consulenza o raccomandazioni finanziarie, di investimento, di trading o di altro tipo fornite o approvate da TradingView. Per ulteriori informazioni, consultare i Termini di utilizzo.