OPEN-SOURCE SCRIPT
Aggiornato [blackcat] L1 Ehlers Every Little Bit Helps
Level 1
Background
Inspired by "Averaging The Open And Close To Reduce Noise" on March 2023 by John F. Ehlers’ article in the March issue, “Every Little Bit Helps”, I further smooth it because noise was still large and “Every Little Bit Does Not Helps Much”.
Function
In John F. Ehlers' 03/2023 article, "Every Little Bit Helps," he suggests that noise can be reduced by simply averaging the open and close prices of a bar, rather than just using the close price. The data sampling example presented in this article compares the traditional RSI using close data to an RSI calculated using the average of the open and close.
Compared to RSI, I used my customized RMI version which is more suitable for moment smoothing. For example, the price entry of the 1st RMI can be changed from Close to (Close + Open) / 2. In fact, the RMI indicator itself has a price input that can be changed in a similar way. You can change the input parameter "m" to "More Help", which is 5 by default.
Remarks
Feedbacks are appreciated.
Note di rilascio
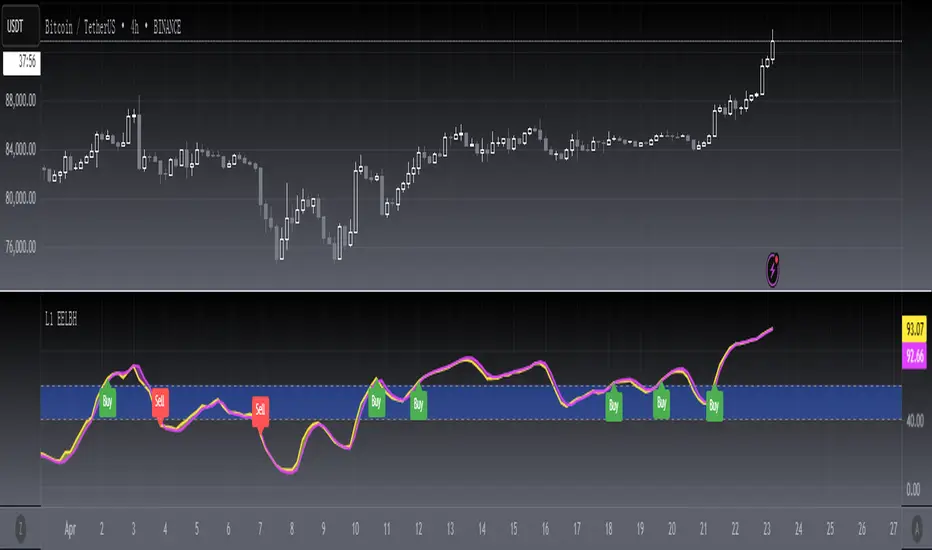
OVERVIEWThe [blackcat] L1 Ehlers Every Little Bit Helps indicator is designed to provide insights into market momentum using the Relative Momentum Index (RMI). This script calculates RMI values for both the closing price and the average of opening and closing prices, offering traders a comprehensive view of market trends. By plotting these values and filling areas between them, users can easily identify potential buy and sell opportunities 📈💹.
FEATURES
Calculates Relative Momentum Index (RMI) for different data sources:
Close Price: Yellow line representing RMI without sampling.
Average of Open and Close Prices: Fuchsia line representing RMI with sampling.
Plots RMI values on a separate pane for clear visualization 📊
Fills the area between the two RMI plots to highlight differences:
Yellow fill when Close RMI is above Average RMI.
Fuchsia fill when Average RMI is above Close RMI.
Includes horizontal lines at 40 and 60 levels for reference:
Blue fill between the 40 and 60 levels.
Displays buy ('Buy') and sell ('Sell') labels on the chart for quick identification 🏷️
Generates alerts based on RMI crossovers at key levels 🔔
HOW TO USE
Add the indicator to your TradingView chart by selecting it from the indicators list.
Adjust the RMI Momentum parameter to suit your preferred sensitivity ⚙️.
Monitor the chart for buy and sell labels indicating potential trade opportunities.
Set up alerts based on the generated signals to receive notifications when conditions are met 📲.
Use the filled areas and horizontal lines as additional context for market sentiment analysis.
LIMITATIONS
The indicator may generate false signals in highly volatile or ranging markets 🌪️.
Users should combine this indicator with other forms of analysis for more reliable trading decisions.
The effectiveness of the indicator may vary depending on the asset and timeframe being analyzed.
NOTES
Ensure that you have sufficient historical data available for accurate calculations.
Test the indicator thoroughly on demo accounts before applying it to live trading 🔍.
Customize the appearance and parameters as needed to fit your trading strategy.
Script open-source
Nello spirito di TradingView, l'autore di questo script lo ha reso open source, in modo che i trader possano esaminarne e verificarne la funzionalità. Complimenti all'autore! Sebbene sia possibile utilizzarlo gratuitamente, ricordiamo che la ripubblicazione del codice è soggetta al nostro Regolamento.
Avoid losing contact!Don't miss out! The first and most important thing to do is to join my Discord chat now! Click here to start your adventure: discord.com/invite/ZTGpQJq 防止失联,请立即行动,加入本猫聊天群: discord.com/invite/ZTGpQJq
Declinazione di responsabilità
Le informazioni e le pubblicazioni non sono intese come, e non costituiscono, consulenza o raccomandazioni finanziarie, di investimento, di trading o di altro tipo fornite o approvate da TradingView. Per ulteriori informazioni, consultare i Termini di utilizzo.