PROTECTED SOURCE SCRIPT
Filtered Stochastic MA
🔴 Filtered Stochastic MA (FSM) 🔴
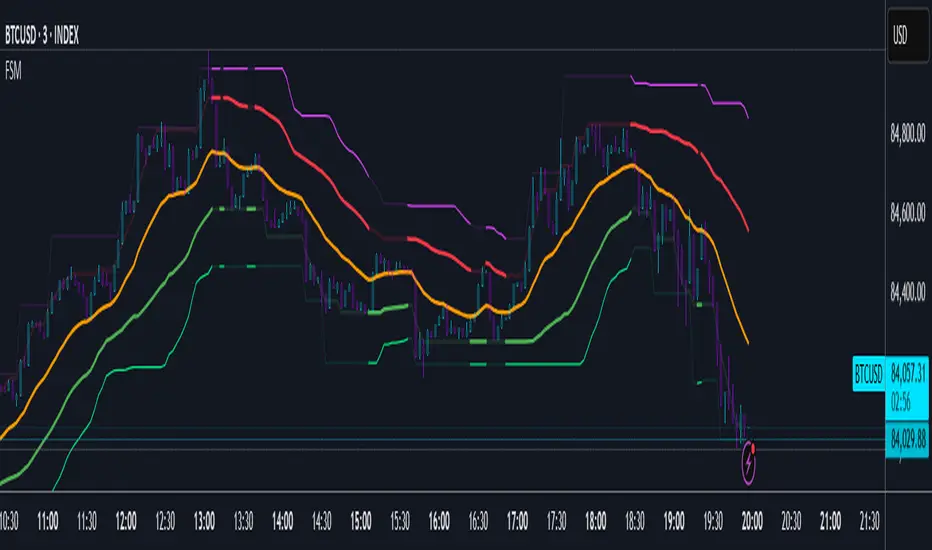
Filtered Stochastic MA (FSM) is an all‑in‑one overlay that combines an adaptive moving average, momentum analysis, and dual volatility bands to give you clear, actionable levels on any chart.
🔧 Core Components
Center MA with “Custom” Filters
Hidden Stochastic Momentum
A built‑in %K/%D oscillator runs quietly under the hood, helping the bands adapt to shifting momentum without cluttering your chart.
Dual SuperTrend‑Style Bands
⚙️ Key Settings
📈 How to Trade with FSM
1. Trend‑Following Entries
Example: On a 15 min chart of EUR/USD, set MA = 20 EMA, ATR = 1, StdDev = 1. When price dips to the green Band 1 and then closes back above it, risk a long with stop just below the band.
2. Breakout & Exhaustion Plays
A decisive close above Resistance Band 2 signals a strong breakout. Look to ride the impulse or wait for a retest of Band 2 as support.
Conversely, a break below Support Band 2 can mark trend exhaustion or a reversal opportunity.
Example: On a 1 hour BTCUSD chart with MA = 50 (Custom 1), watch for candle closes beyond the outer fuchsia band—enter on a successful retest for better risk/reward.
3. Mean‑Reversion Scalp Setups
In range or low‑volatility conditions, price swings outside Band 1 often snap back toward the Center MA. Fade these extremes on fast timeframes (1–5 min).
Example: On a 5 min Apple stock chart, when the price spikes above Resistance Band 1 and fails to hold, short toward the Center MA for a quick scalp.
4. Momentum Confirmation
Use the hidden stochastic readings (via the Data Window or your own alerts) to confirm entries:
Favor long setups when momentum is rising.
Avoid shorts when momentum remains strong above 50, even if bands are touched.
FSM brings together smoothing, momentum, and volatility in a single, clean overlay. Adjust the “Custom” filters and band widths to match your market and timeframe, and use the examples above as a starting point to build your own high‑probability setups.
Add “Filtered Stochastic MA (FSM)” to your TradingView chart today and turn noisy data into precision entry and exit zones!
Caution:
This is an educational idea, past performance or what you see on a chart may not be repeatable behavior. Trade at your own risk.
Regards!
Filtered Stochastic MA (FSM) is an all‑in‑one overlay that combines an adaptive moving average, momentum analysis, and dual volatility bands to give you clear, actionable levels on any chart.
🔧 Core Components
Center MA with “Custom” Filters
- Choose from familiar SMAs, EMAs, WMAs, HMAs, RMAs … or select “Custom 1” and “Custom 2” for two proprietary smoothing methods that react gracefully in both trends and chop.
- Tune the length to match your style—from fast scalp MAs (10–20) to smoother swing MAs (50+).
Hidden Stochastic Momentum
A built‑in %K/%D oscillator runs quietly under the hood, helping the bands adapt to shifting momentum without cluttering your chart.
Dual SuperTrend‑Style Bands
- Band 1 (standard multipliers) hugs the Center MA to mark early support/resistance.
- Band 2 (double multipliers) creates a wider envelope for breakout thresholds and over‑extension signals.
- Both fade or highlight based on market direction for instant visual cues.
⚙️ Key Settings
Setting Description
MA Type & Length Pick your smoothing style and period.
Stochastic Length Controls momentum sensitivity.
Band Multipliers ATR & StdDev factors for Band 1 (and ×2 for Band 2).
Color Controls Customize colors and opacity for each band and the MA.
Non‑Repainting Lock signals to the previous bar for extra safety.
📈 How to Trade with FSM
1. Trend‑Following Entries
- Long when price pulls back toward Support Band 1 in an uptrend (price > Center MA and Support Band 1 is rising).
- Short when price rallies into Resistance Band 1 in a downtrend (price < Center MA and Resistance Band 1 is falling).
Example: On a 15 min chart of EUR/USD, set MA = 20 EMA, ATR = 1, StdDev = 1. When price dips to the green Band 1 and then closes back above it, risk a long with stop just below the band.
2. Breakout & Exhaustion Plays
A decisive close above Resistance Band 2 signals a strong breakout. Look to ride the impulse or wait for a retest of Band 2 as support.
Conversely, a break below Support Band 2 can mark trend exhaustion or a reversal opportunity.
Example: On a 1 hour BTCUSD chart with MA = 50 (Custom 1), watch for candle closes beyond the outer fuchsia band—enter on a successful retest for better risk/reward.
3. Mean‑Reversion Scalp Setups
In range or low‑volatility conditions, price swings outside Band 1 often snap back toward the Center MA. Fade these extremes on fast timeframes (1–5 min).
Example: On a 5 min Apple stock chart, when the price spikes above Resistance Band 1 and fails to hold, short toward the Center MA for a quick scalp.
4. Momentum Confirmation
Use the hidden stochastic readings (via the Data Window or your own alerts) to confirm entries:
Favor long setups when momentum is rising.
Avoid shorts when momentum remains strong above 50, even if bands are touched.
FSM brings together smoothing, momentum, and volatility in a single, clean overlay. Adjust the “Custom” filters and band widths to match your market and timeframe, and use the examples above as a starting point to build your own high‑probability setups.
Add “Filtered Stochastic MA (FSM)” to your TradingView chart today and turn noisy data into precision entry and exit zones!
Caution:
This is an educational idea, past performance or what you see on a chart may not be repeatable behavior. Trade at your own risk.
Regards!
Script protetto
Questo script è pubblicato come codice protetto. Tuttavia, è possibile utilizzarle liberamente e senza alcuna limitazione – ulteriori informazioni qui.
“There are those who think they are studying the market—when all they are doing is studying what someone has said about the market . . . not what the market has said about itself.”
Declinazione di responsabilità
Le informazioni e le pubblicazioni non sono intese come, e non costituiscono, consulenza o raccomandazioni finanziarie, di investimento, di trading o di altro tipo fornite o approvate da TradingView. Per ulteriori informazioni, consultare i Termini di utilizzo.