OPEN-SOURCE SCRIPT
Aggiornato Single Candle Model-DTFX
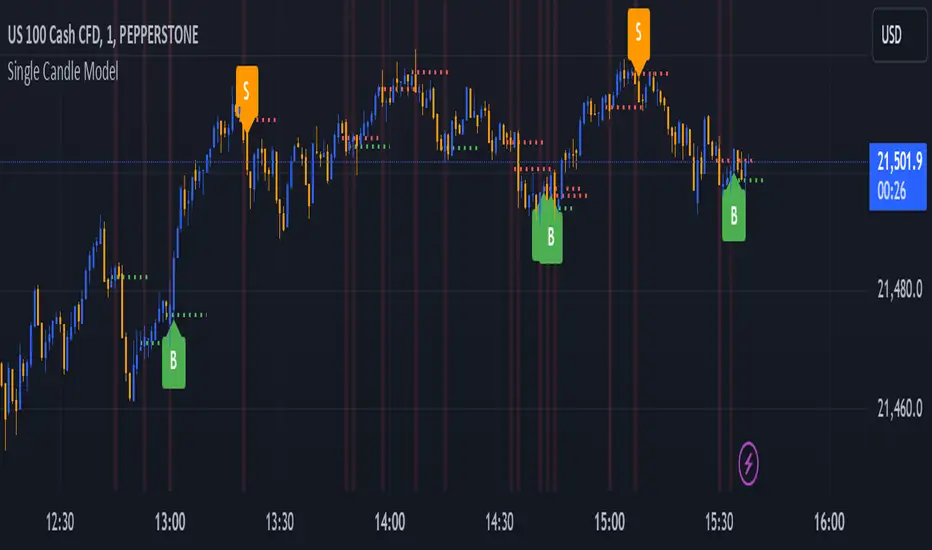
The script identifies the candles with engulfing body and marks the 50% of the candle for easy entry based on model of #DTFX single candle entry
Interpreting the Signals:
Look for candles labeled as "BE". These represent significant price action where the range is larger than the previous candle's range.
Pay attention to the 50% line of the "BE" candle:
A green line indicates a bullish "BE" candle.
A red line indicates a bearish "BE" candle.
Watch for Buy ("B") and Sell ("S") labels:
"B": Indicates a potential bullish breakout.
"S": Indicates a potential bearish breakdown.
Alerts:
Configure alerts in TradingView to notify you whenever a "B" or "S" signal is detected. This allows you to act on the signals without constantly monitoring the chart.
Use in Trading Strategies:
Combine this indicator with other tools like support/resistance levels, moving averages, or trend analysis to validate the signals.
Use the midpoint (50% line) of the "BE" candle as a potential reference point for stop-loss or target levels.
Customizations:
Adjust the appearance of labels and lines by modifying their style, color, or placement in the script.
Add filters (e.g., timeframes or volume conditions) to refine the detection of "BE" candles.
This indicator helps traders identify pivotal price movements and act on potential breakouts or breakdowns with clear visual markers and alerts.
Note di rilascio
updated for the overlayScript open-source
Nello spirito di TradingView, l'autore di questo script lo ha reso open source, in modo che i trader possano esaminarne e verificarne la funzionalità. Complimenti all'autore! Sebbene sia possibile utilizzarlo gratuitamente, ricordiamo che la ripubblicazione del codice è soggetta al nostro Regolamento.
Declinazione di responsabilità
Le informazioni e le pubblicazioni non sono intese come, e non costituiscono, consulenza o raccomandazioni finanziarie, di investimento, di trading o di altro tipo fornite o approvate da TradingView. Per ulteriori informazioni, consultare i Termini di utilizzo.
Script open-source
Nello spirito di TradingView, l'autore di questo script lo ha reso open source, in modo che i trader possano esaminarne e verificarne la funzionalità. Complimenti all'autore! Sebbene sia possibile utilizzarlo gratuitamente, ricordiamo che la ripubblicazione del codice è soggetta al nostro Regolamento.
Declinazione di responsabilità
Le informazioni e le pubblicazioni non sono intese come, e non costituiscono, consulenza o raccomandazioni finanziarie, di investimento, di trading o di altro tipo fornite o approvate da TradingView. Per ulteriori informazioni, consultare i Termini di utilizzo.