OPEN-SOURCE SCRIPT
Aggiornato Correlations P/L Range (in percent)
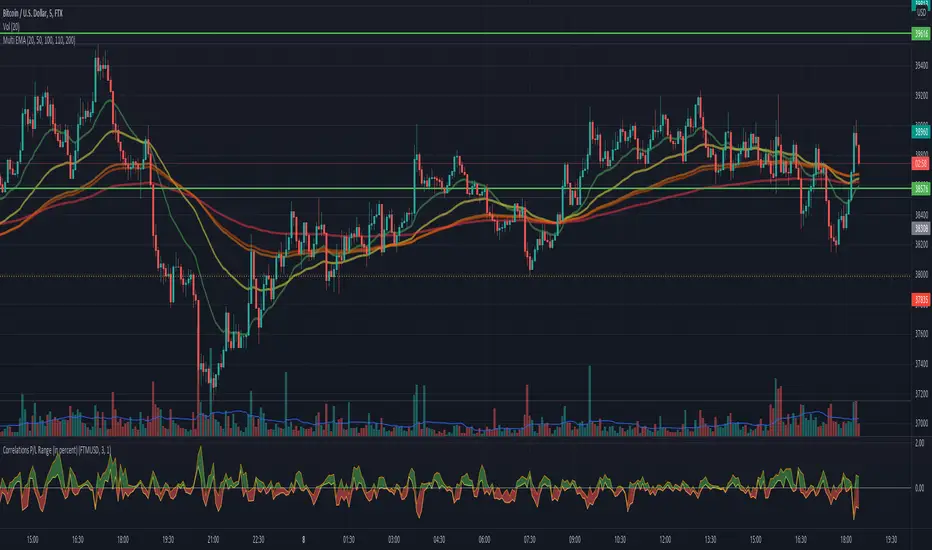
This script shows the inefficiency of the markets.
Comparing two (correlated) symbols, the values above 0 means the main symbol (at the top of the graph)
outperforms the other. A value below 0 means the main symbol underperforms the other.
The band displays different entries until the last candle. Any P/L (of the band range)
is visible in the band. Example: given a band range length of 5, then all last 5 values
are compares with the current value for both symbols. Or in other words:
If symbol A, lets say ETHUSD outperforms, lets say BITCOIN (the main symbol), in the last
5 candles, then we would see all values of the band are negative.
Any question, comment or improvements are welcome.
Note di rilascio
see description of the scriptScript open-source
Nello spirito di TradingView, l'autore di questo script lo ha reso open source, in modo che i trader possano esaminarne e verificarne la funzionalità. Complimenti all'autore! Sebbene sia possibile utilizzarlo gratuitamente, ricordiamo che la ripubblicazione del codice è soggetta al nostro Regolamento.
Declinazione di responsabilità
Le informazioni e le pubblicazioni non sono intese come, e non costituiscono, consulenza o raccomandazioni finanziarie, di investimento, di trading o di altro tipo fornite o approvate da TradingView. Per ulteriori informazioni, consultare i Termini di utilizzo.
Script open-source
Nello spirito di TradingView, l'autore di questo script lo ha reso open source, in modo che i trader possano esaminarne e verificarne la funzionalità. Complimenti all'autore! Sebbene sia possibile utilizzarlo gratuitamente, ricordiamo che la ripubblicazione del codice è soggetta al nostro Regolamento.
Declinazione di responsabilità
Le informazioni e le pubblicazioni non sono intese come, e non costituiscono, consulenza o raccomandazioni finanziarie, di investimento, di trading o di altro tipo fornite o approvate da TradingView. Per ulteriori informazioni, consultare i Termini di utilizzo.